
Gold briefly breached the support at $1,250 yesterday but bulls managed to step in and hold the price above the support level at the end of day. While the trend remains bullish, a break below yesterday's low at $1,247.50 may push the price towards $1,235 at least.
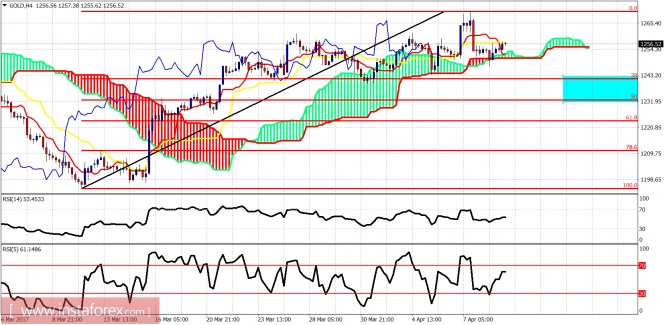
Gold price is trading above the 4 hour Ichimoku cloud. Support is at $1,250-47. Once the price breaks below it, we should see a deeper pullback towards the 38% and 50% Fibonacci retracements. Resistance is at $1,263.
Blue line - long-term support
Red line - resistance
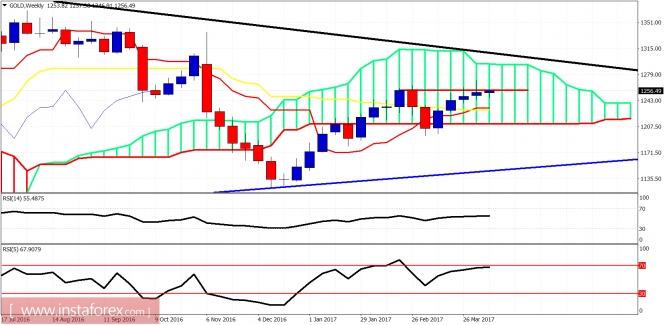
The weekly candle is trying to break above the weekly resistance at $1,263 . The price is inside the weekly Kumo cloud, implying the weekly trend remains neutral as long as we are below the black trend line resistance and above the blue trend line support. I expect the price to eventually break above the weekly resistance as I believe in 2015 the $1,045 low was a long-term low and reversal level.
The material has been provided by InstaForex Company - www.instaforex.com