
Gold price made a bearish reversal on Friday despite the worse-than-expected NFP figures announced. Gold may have made a short-term top but we will be sure about it if we break below $1,250 and exit the bullish channel. Overall, my longer-term view remains unchanged.
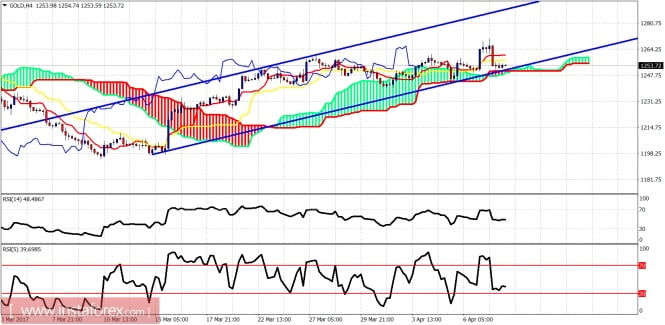
Gold price is trading above the Ichimoku cloud and still inside the bullish channel. Support is at $1,250. Resistance is at $1,262. Price has broken below the tenkan- and kijun-sen, so we have a short-term bearish indicator.
Blue line - support Trend line
Black line- long-term resistance trend line
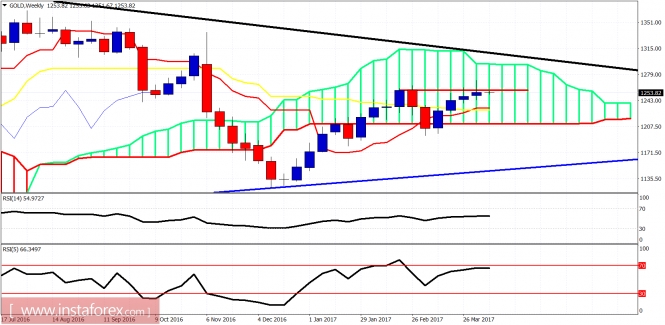
The weekly candle from last week is not a good one. The inability to hold above $1,263 despite the new high is a failure sign. This is only bad for the short term in order to relieve the overbought conditions. So we could see a pullback towards $1,230 before we resume the uptrend. I remain longer-term bullish expecting a move above $1,300 before July.
The material has been provided by InstaForex Company - www.instaforex.com