
Gold price stopped its rise at the previous highs near $1,263 and is showing reversal signs. A back test of the break out area at $1,247-50 is justified. In the long term I remain bullish expecting a move to $1,300-$1,310 first.
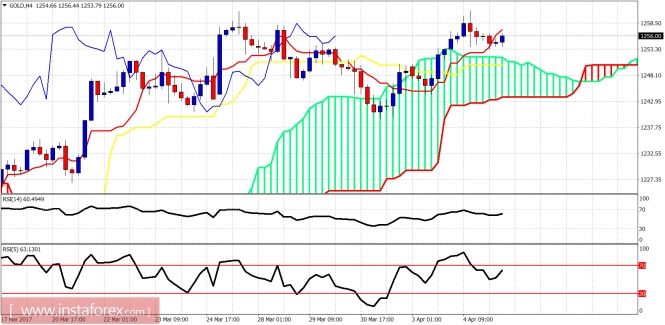
Gold is trading above the Ichimoku cloud. Trend is bullish in the 4-hour chart. The price might re-test cloud support at $1,250. Short-term support is at $1,250 and the next is at $1,242. Resistance is at $1,263 and the next one is at $1,280-90.
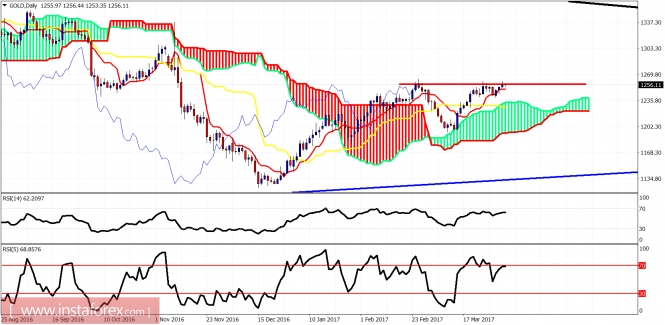
The Daily candle is above the Ichimoku cloud. Trend is bullish. We have a daily cross of the tenkan-sen (red line indicator) above the kijun-sen (yellow line indicator) while above the cloud. This is a textbook bullish signal in Ichimoku terms.
The material has been provided by InstaForex Company - www.instaforex.comfrom www.instaforex.com