
Technical outlook:
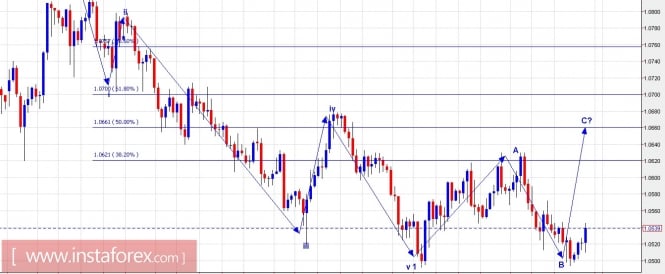
The EURUSD 4H chart has been depicted here with the alternate wave count discussed on March 01, 2017. The aggressive longs are coming into play with momentum oscillators also showing some up tick but it remains to be seen if the follow through is coming well or not. It could be possible that the entire drop from 1.0829 through 1.0492 levels can be looked into an impulse, that unfolded into 5 waves labelled i through v 1 above. The subsequent rally through 1.0630 levels as wave A, and the drop yesterday toward 1.0493 levels as wave B and wave C could terminate at near 1.0650 levels as labelled here. It is good to remain long for now with strict stop below 1.0492 levels to take advantage of the potential counter trend rally unfolding into its last leg. As an alternate though please watch out for resistance at 1.0580 levels as well.
Trading plan:
Please remain long, stop at 1.0485/87, target 1.0580 and 1.0650
USDJPY chart setups:
Technical outlook:
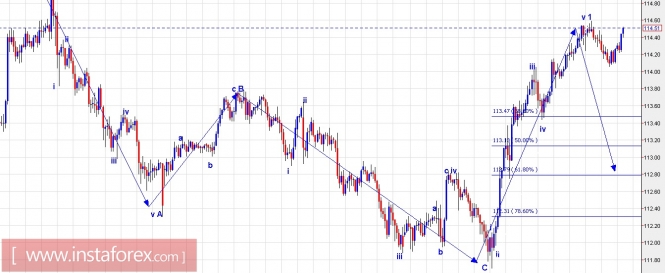
The USDJPY has produced an impressive rally post February 28, 2017 lows at 111.70 levels as seen on the above chart setup. It is a good time to take profits on long positions suggested earlier and turn bearish for sort term. The wave count suggests that USDJPY had dropped earlier in a zigzag fashion A-B-C (5-3-5) as labelled above. The subsequent rally looks to be an impulse, labelled i through v 1. The most likely and probable wave count from here on is a drop lower toward 112.60/80 levels which is also the fibonacci 0.618 support of the recent rally as depicted here. Immediate support is seen at 113.40 levels while resistance is at 114.59 levels respectively. An aggressive short setup is on cards from current levels.
Trading plan:
Aggressive trade setup is to go short now, stop at 114.65, targeting 112.60 /80 levels. More conservative strategy is to remain flat for now and look to buy at lower levels.
Fundamental outlook:
Watch out for USD ISM- Non Manufacturing Composite, unchanged at 10:00 AM EST and FED Chair Yellen Speech at Chicago at 01:00 PM EST.
Good Luck!
The material has been provided by InstaForex Company - www.instaforex.com