
Gold price remains inside the bearish channel and in the bearish short-term trend. The deeper than expected pullback has not changed my longer-term bullish view on Gold. I continue to expect to see Gold above $1,400 over the coming months in 2017.
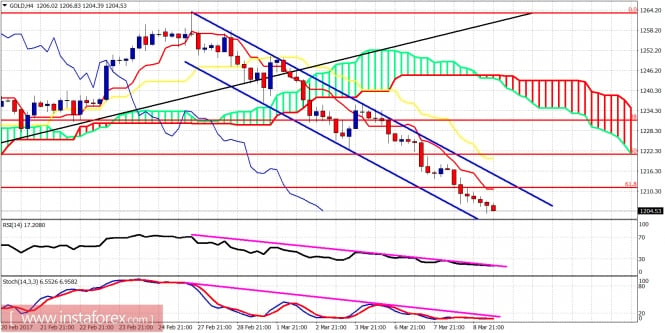
Purple lines - resistance lines
The short-term trend is bearish. Resistance is at $1,211 and the next is at $1,215. Bigger resistance is at $1,220 and cloud resistance at $1,240. Trend changes to bullish above $1,240. Watch closely the oscillators. A break above the purple trend line resistance will be a bullish short-term reversal sign.
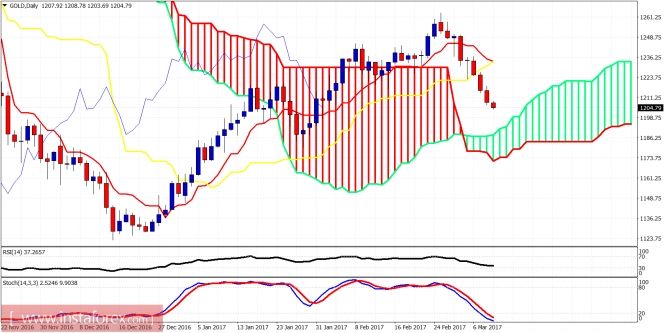
Stochastic oscillator is oversold in the Daily chart. The price is approaching daily cloud support at $1,190. Daily trend change will be confirmed only on a break above $1,236 on a daily close. This pullback in Gold is of similar importance to the pullback from $1,375 to $1,120. This pullback should produce a higher low and a new upward reversal.
The material has been provided by InstaForex Company - www.instaforex.com