
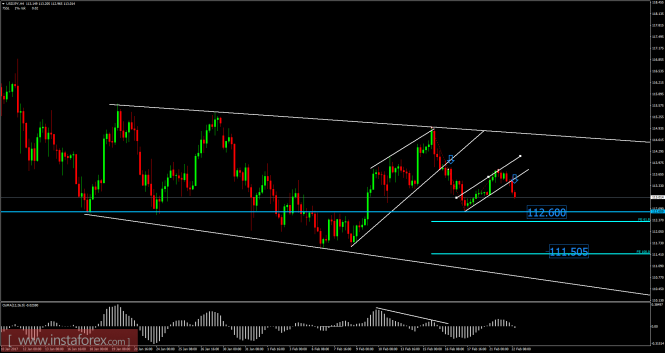
Recently, the USD/JPY pair has been trading downwards. The price tested the level 112.97. According to the 4H time frame, I found broken bearish flag in the background and expanded diagonal. There is also a hidden bearish divergence in the background, which is another sign of weakness. My advice is to watch for selling opportunities on the pullbacks. I have placed Fibonacci expansion to find potential downward targets. The first target is set at the price of 112.60 and second target is set at the price of 111.50 (Fibonacci expansion 100%).
Resistance levels:
R1: 113.75
R2: 113.95
R3: 114.20
Support levels:
S1: 113.25
S2: 113.05
S3: 112.80
Trading recommendations for today: watch for potential selling opportunities.
The material has been provided by InstaForex Company - www.instaforex.com