
Technical Outlook:
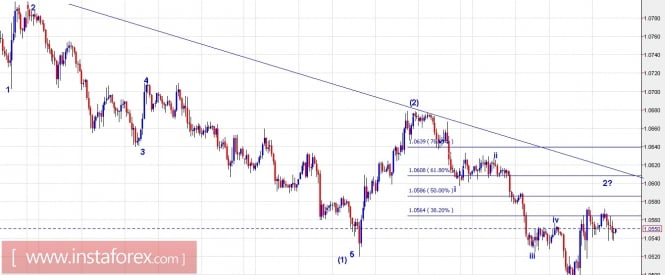
As seen on the hourly chart displayed here, the EUR/USD pair is firm on its way towards parity levels as discussed and expected last week. Looking into the wave structure, it is more than clear that the pair has produced waves (1) and (2) within the wave (3), which should unfold into 5 wave towards 1.0300 and 1.0000 at least. The rally from yesterday's lows at 1.0492 is expected to unfold into 3 waves, towards 1.0600/10 levels as depicted here as wave 2?. Please also note that the resistance trend line from 1.0830 is also converging. Besides, fibonacci 0.618 ratio is also seen at 1.0608 respectively. Resistance is lined up at 1.0680 and the pair is expected to push lower till the resistance holds. Intermediary support is seen at 1.0492 levels.Selling on rallies through 1.0600/10 levels remains a safe trading strategy for today's New York Session.
Trading Plan:
The pair is expected to first produce a rally towards 1.0600/10 levels and then reverse lower, towards its larger trend. The trade setups are explained below:
Aggressive traders might want to go long with stop at 1.0490, targeting 1.0600/10 today.
Conservative traders might want to remain flat initially and look to sell around 1.0600/10 levels and also towards 1.0700 levels with stop at 1.0850 levels, targeting 1.0000 levels going forward. Please note that the target should unfold in coming weeks.
USDJPY Chart Setups:
Technical outlook:
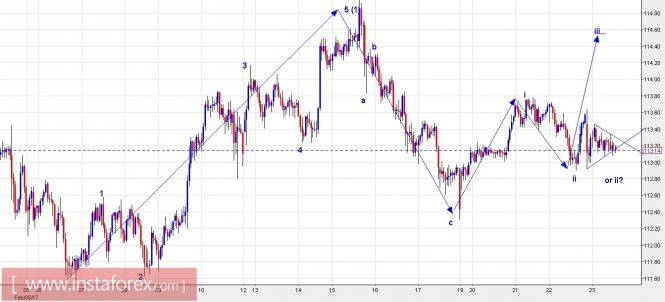
The hourly chart setup depicted above indicates a potential rally of USD/JPY in the short and medium terms. As for the wave structure, please note that the pair has unfolded into 5 waves (impulse) between 111.60 and 114.95 levels, labelled as wave (1). Also note that the drop towards 112.30 last Friday was corrective in nature, labelled as waves a, b, and c respectively. The pair is now expected to produce another 5-wave rally towards 117.00 and higher respectively. In the last 3 trading days, USD/JPY has produced waves i and ii which terminated at 112.90 yesterday. If the above wave scenario comes true, the next leg should be higher towards at least 114.00 (wave iii). Ideally, prices should remain above 112.30 from here. Today, during New York session, I expect a flash low potentially towards 112.87 levels before the pair begins to rally. Buying on dips is a safe strategy going forward.
Trading plan:
One should be looking to buy towards 112.90/113.00 levels today, with stop ideally below 111.60 and target 117.00 and 120.00 in the weeks to come.
Fundamental Outlook:
With number of low impact data lined up at 08:30 AM EST, please do not expect huge volatility. Initial Jobless Claims (240K, forecast) and Housing price purchase index (0.5%, forecast) are the ones to watch out for.
Good luck!
The material has been provided by InstaForex Company - www.instaforex.com