
The Dollar index is showing reversal signs to the upside by breaking above and out of the downward sloping wedge. It is important to see if the break out is real or fake. My view that we are near completion of wave 4 remains and I expect a strong upward reversal in the index to new highs.
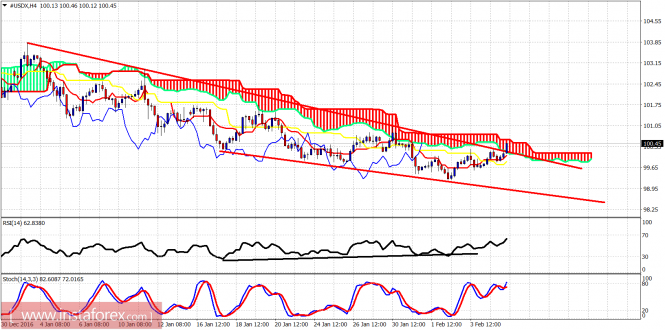
The price is breaking out of the downward sloping wedge. This is a bullish sign. The price is still below the Ichimoku cloud but very close to breaking above it. Oscillators have provided signals of diverging lows and this has been pointing that the trend would soon reverse. Maybe that time has come.
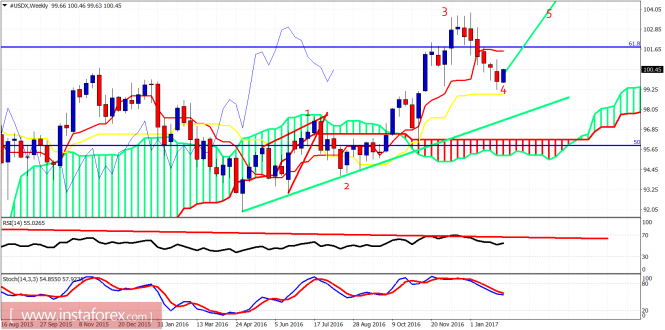
On a weekly basis, the Dollar index has reached the kijun-sen (yellow line indicator) which was our target. The price shows reversal signs. My view so far was that this decline from 103.70 is wave 4 and we should start an upward move as wave 5 towards 105. It is important to see how this weekly candle closes and also how today's candle closes to be more sure regarding the possibility of one more new lower low.
The material has been provided by InstaForex Company - www.instaforex.com