
Overview:
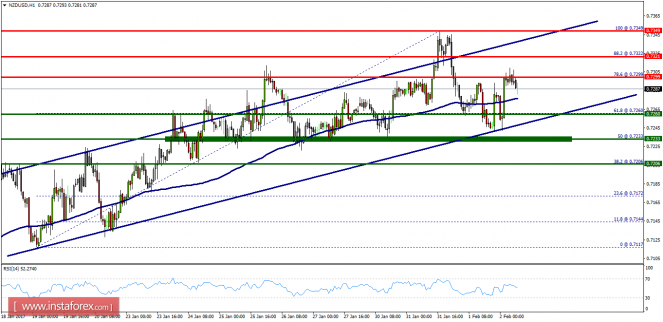
- The NZD/USD pair continues moving upwards from the levels of 0.7233 and 0.7260. Yesterday, the pair rose from the level of 0.7260 which coincides with a ratio of 61.8% Fibonacci retracement to a top around 0.7299. Today, the first support level is seen at 0.7260 followed by 0.7233, while daily resistance 1 is seen at 0.7299. According to the previous events, the NZD/USD pair is still moving between the levels of 0.7230 and 0.7300. On the one-hour chart, immediate resistance is seen at 0.7299, which coincides with a ratio of 78.6% Fibonacci retracement. Currently, the price is moving in a bullish channel. This is confirmed by the RSI indicator signaling that we are still in a bullish trending market. Therefore, if the trend is able to break through the first resistance level of 0.7300, we should see the pair climbing towards the next objective at 0.7349 to test the double top. On the other hand, in case a reversal takes place and the NZD/USD pair breaks through the support level of 0.7260, a further decline to 0.7206 can occur. This would indicate a bearish market.