MG Network

something big isHappening!

In the mean time you can connect with us with via:

Copyright © Money Grows Network | Theme By Gooyaabi Templates

Money Grows Network

Archive

Powered by Blogger.

Welcome To Money Grows Network

Verified By

2006 - 2019 © www.moneygrows.net

Investments in financial products are subject to market risk. Some financial products, such as currency exchange, are highly speculative and any investment should only be done with risk capital. Prices rise and fall and past performance is no assurance of future performance. This website is an information site only.

Popular

Pages

Expert In

Name*


Message*

Technical analysis of gold for February 1, 2017

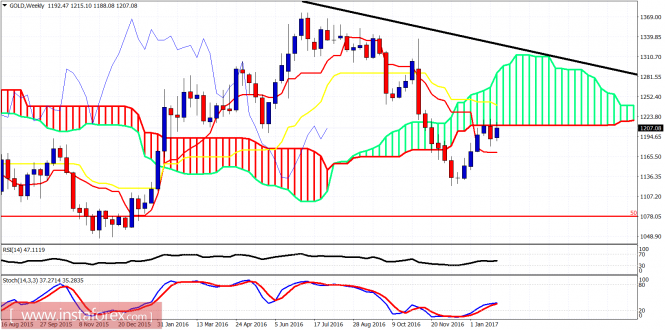
Gold price has moved higher yesterday due to a weaker Dollar following remarks made by POTUS Donald Trump. Gold however did not make a new higher high above $1,220. The short-term bearish scenario is still open with a pull back towards $1,160.

analytics5891972974e23.png

Red line - short-term support trend line

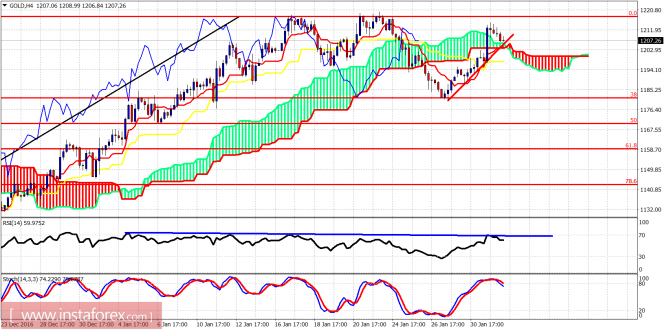
Blue line- bearish divergence

Gold price has broken above the Ichimoku cloud on the 4-hour chart. Price is still diverging (RSI) and at overbought levels (Stochastic). Bulls need to break above $1,220 to move higher towards $1,285. However I favor a pull back at least towards $1,200. $1,180 is important short-term support. If broken we can see Gold near $1,160-40.

analytics589197a95f515.png

On a weekly basis Gold price remains below the lower cloud boundary. The rejection levels from last week are being tested. I believe Gold will eventually pull back lower towards $1,160-40 to complete the corrective pattern we expect. Next weekly resistance if $1,220 is broken is at $1,250.The material has been provided by InstaForex Company - www.instaforex.com