MG Network

something big isHappening!

In the mean time you can connect with us with via:

Copyright © Money Grows Network | Theme By Gooyaabi Templates

Money Grows Network

Archive

Powered by Blogger.

Welcome To Money Grows Network

Verified By

2006 - 2019 © www.moneygrows.net

Investments in financial products are subject to market risk. Some financial products, such as currency exchange, are highly speculative and any investment should only be done with risk capital. Prices rise and fall and past performance is no assurance of future performance. This website is an information site only.

Popular

Pages

Expert In

Name*


Message*

Analysis of gold for February 21, 2017

analytics58ac1ce342d58.png

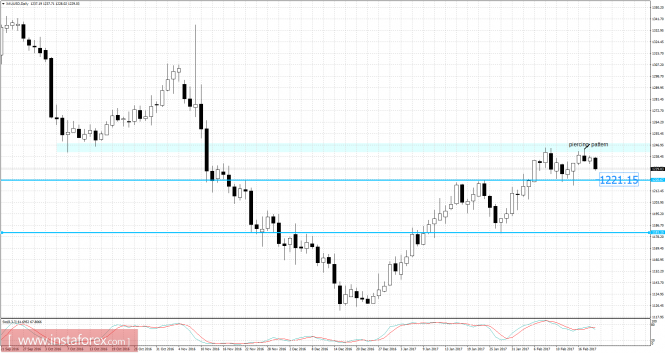
Recently, gold has been trading downwards. The price tested the level $1,228.02. On the daily time frame, I found successful rejection from strong recistance at the price of $1,244.00. I found bearish piercing pattern, which is a sign that gold may go lower. Watch for potential selling opportunities. First downward target is set at the price of $1,221.00.

Daily Fibonacci levels:

Resistance levels:

R1: $1,239.80

R2: $1,241.40

R3: $1,243.90

Support levels:

S1: $1,234.75

S2: $1,233.15

S3: $1,230.60

Trading recommendations for today: watch for potential selling opportunities.

The material has been provided by InstaForex Company - www.instaforex.com