
The dollar index is still inside the bearish channel on a short-term basis. Price is heading towards 100 where the medium-term support is found. If the index breaks above 102.65, the trend can change to bullish targeting 105-106.
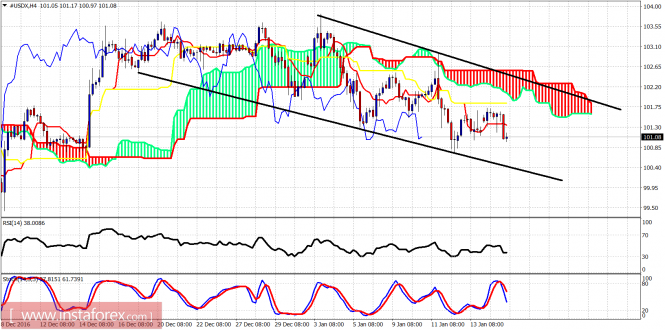
Price is making lower lows and lower highs. The fact that it is trading below the Ichimoku cloud confirms the bearish trend. Short-term support is at 100.50 while resistance lies at 102. Bulls need to break above 102.65 in order to confirm a bullish trend reversal. However there are still no signs of a bullish divergence on the 4 hour chart, so the dollar index may continue to be pressured.
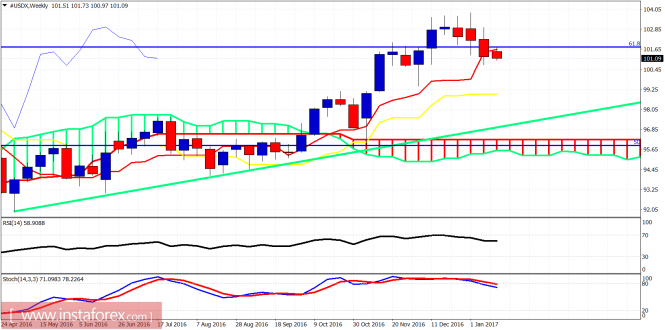
On a weekly basis, we can see the index closed last week below the Tenkan-Sen (red line indicator). A lower low this week will open the way for a move lower towards the Kijun-sen (yellow line indicator) at 99 where critical long-term support is found. The oscillators are turning lower from overbought levels and this is a bearish long-term sign. The long-term green trend line remains the most important support of the longer-term trend.
The material has been provided by InstaForex Company - www.instaforex.com