
Gold price continues to trade in a bullish short-term trend as price is making higher highs and higher lows on the 4-hour chart and has already backtested and broken above the Ichimoku cloud. Resistance of great importance is now found at $1,203.
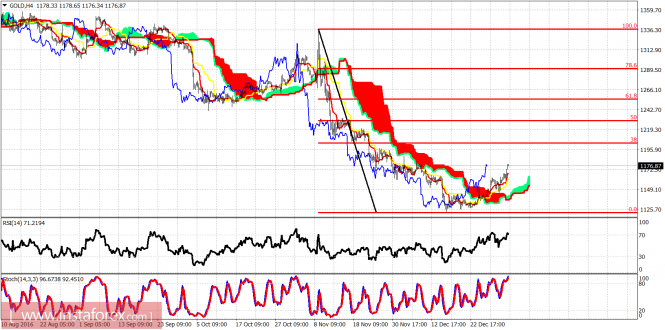
The 38% Fibonacci retracement of the decline from the post-election highs to recent lows is found at $1,203. I believe we are going to test that area. Price has broken above the short-term Ichimoku cloud and this is the first step for a larger longer-term trend reversal as we have been expecting for some time.
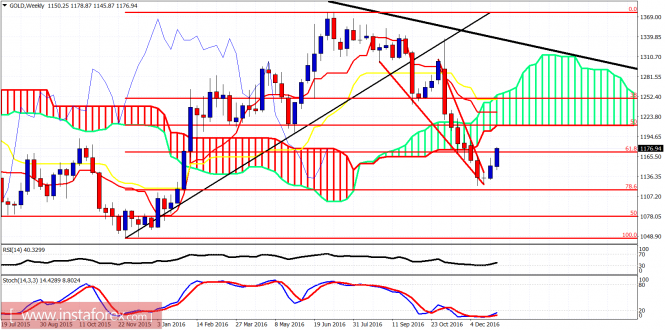
The weekly chart in Gold reminds us that weekly resistance is found at the lower cloud boundary at $1,220. Oscillators are oversold, diverging and turning upwards. We could very well have seen a long-term low in Gold similar to the one made in 2015 at $1,046.
The material has been provided by InstaForex Company - www.instaforex.com