
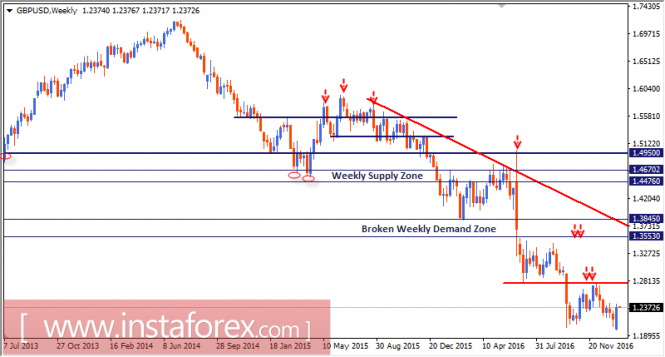
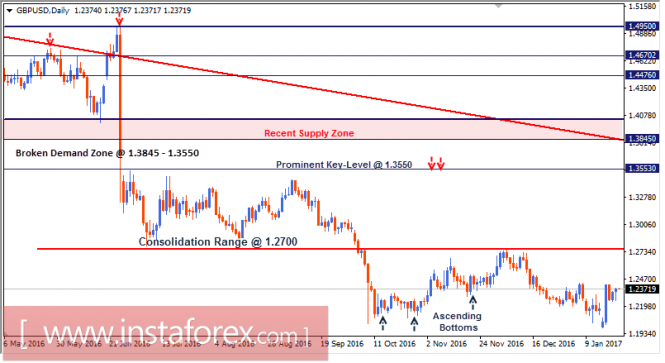
The price zone between 1.3845 and 1.3550 (historical bottoms set in January 2009) was considered a significant demand zone to be watched for bullish recovery.
However, by the end of June a significant bearish break below 1.3550 was expressed as seen on the depicted charts (fundamental reasons). Bearish persistence below the demand level at 1.3550 enhanced the bearish scenario toward the price levels around 1.2700 (Bearish projection target).
Since then, the GBP/USD pair has been trapped inside the depicted consolidation range above 1.2700 until a bearish breakout took place on October 6.
Daily persistence below 1.2700 confirmed the bearish Flag pattern. That is why, a bearish projection target would be located around 1.2020.
On October 25, Bullish recovery was initiated around the price level of 1.2080. That is why, a bullish pullback was executed toward 1.2700-1.2750.
Risky traders considered this bullish pullback toward the price zone of 1.2700-1.2750 to be a valid SELL entry. All T/P levels were successfully reached.
On January 16, Bullish Price action was expressed around the demand level of 1.2000. That's why, a bullish engulfing candlestick was expressed on Tuesday.
Initial bullish target is located around 1.2550 provided that early bullish breakout above 1.2430 is achieved.
Otherwise, the next bearish destination would be located around 1.1200 (Fibonacci Expansion 100%) if bearish momentum is resumed.
The material has been provided by InstaForex Company - www.instaforex.com