
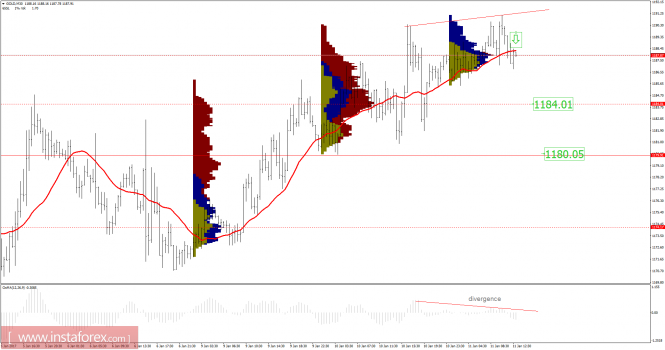
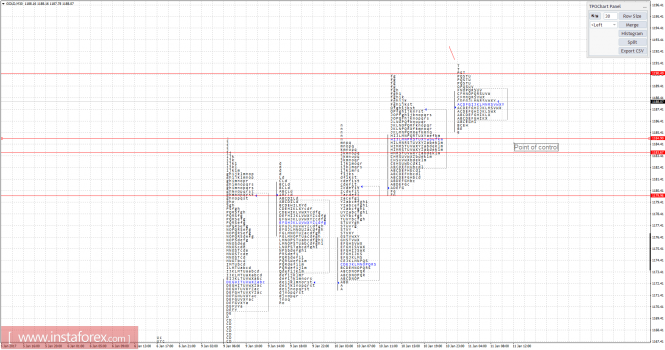
Recently, gold has been trading upwards. The price tested the level of $1,191.10 in an average volume. According to the 30M time frame, I found a fake breakout of yesterday's high, which is a sign of weakness. There is also a divergence in the Moving Average Oscilator. The price made a higher high and the oscilator made a lower high. My advice is to watch for potential selling opportunities. The downward target is set at the price of $1,184.50. Using the TPO Chart, I found yesterday's point of control at the price of $1,184.00. Anyway, if the price breaks the level of $1,191.10 in a high volume, we may see potential testing of $1,195.00
Resistance levels:
R1: 1,187.65
R2: 1,189.00
R3: 1,191.75
Support levels:
S1: 1,182.60
S2: 1,181.00
S3: 1,178.50
Trading recommendations for today: Watch for potential selling opportunities.
The material has been provided by InstaForex Company - www.instaforex.com