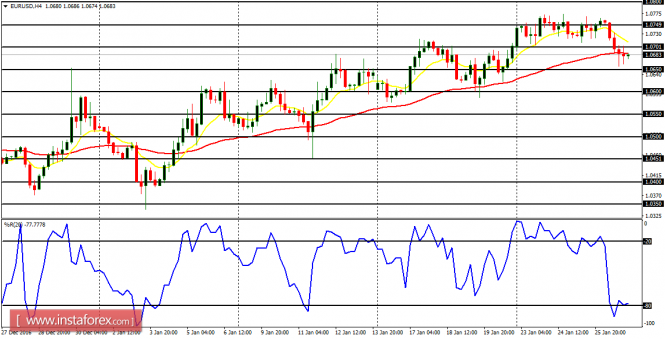
EUR/USD: This pair came down a little on Thursday, though that was too shallow to pose any threat against the current bullish bias. There is a need for price to go down by at least, 200 pips, before the bias can turn bearish in the short-term. Until that happens, the shallow pullback may be another opportunity to go long.
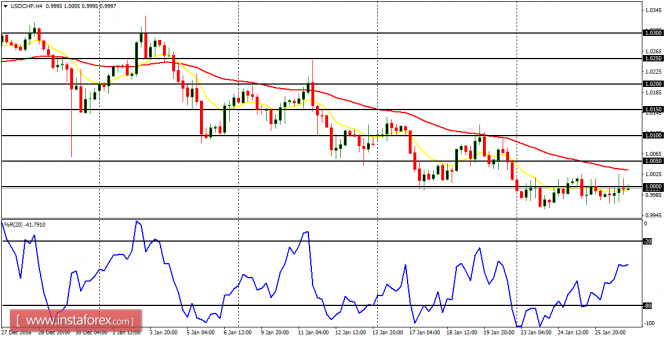
USD/CHF: The USD/CHF pair has gone flat so far this week, in the context of a downtrend. Price is slightly below the psychological level at 1.0000, and while it may temporarily foray above that level, it is generally possible for the bearish movement to resume once momentum returns to the market.
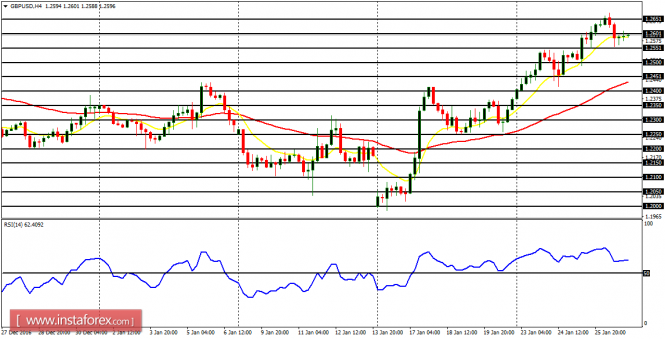
GBP/USD: It is interesting to see that GBP/USD has continued going upwards. Since the beginning of last week, price has moved upwards by 660 pips. The market topped at the distribution territory at 1.2650, and then retraced a bit. The bullish bias is still in place and the market is expected to continue going upwards.
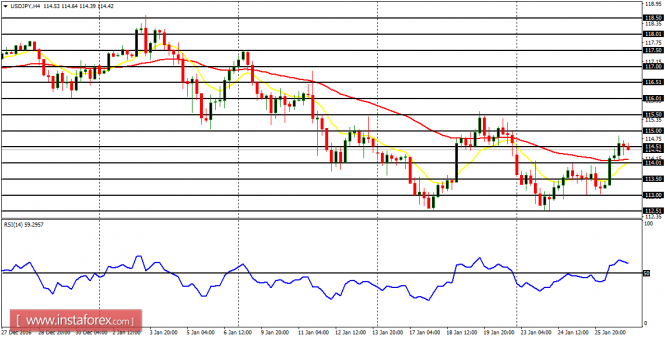
USD/JPY: There are conflicting signals on the USD/JPY – the EMA 11 is below the EMA 56 while the RSI period 14 is above the level 50. It is better to stay away from the market now, until price is able to go upwards or downwards by about 200 pips. That is when a directional bias would form.
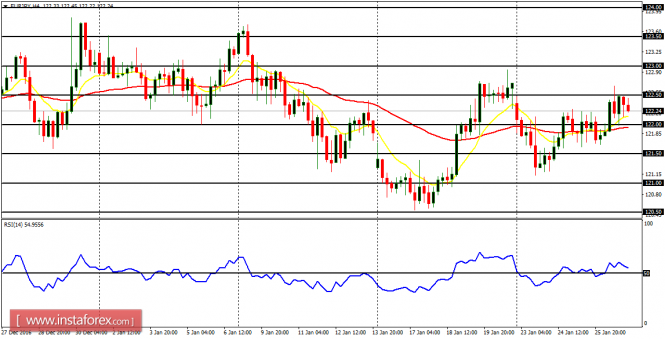
EUR/JPY: There is a short-term "buy" signal in this market. The EMA 11 is above the EMA 56 and the RSI period 14 is above the level 50. The signal is not currently stable, but a movement above the supply zones at 123.50 and 124.00 would result in a Bullish Confirmation Pattern in the market.