
The pair closed last week supported by the 1.2525 level, following a very bullish structure developed from the 200 SMA at H1 chart. GBP/USD isn't giving bearish hints yet, in terms of trend-changing price action, but a breakout below the support level of 1.2420 should strengthen that idea. However, Cable needs to consolidate above the 1.2750 zone in order to reach the 1.2900 level in the short-term.
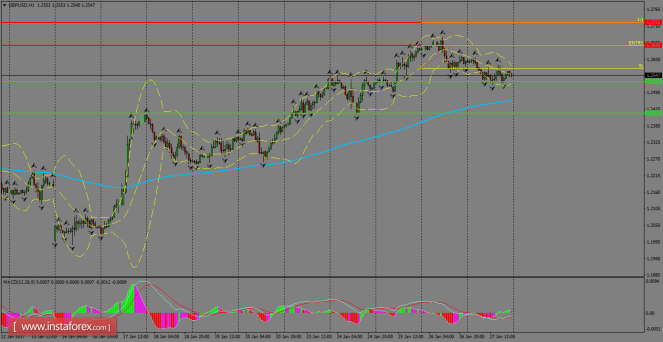
H1 chart's resistance levels: 1.2645 / 1.2721
H1 chart's support levels: 1.2525 / 1.2420
Trading recommendations for today: Based on the H1 chart, buy (long) orders only if the GBP/USD pair breaks a bullish candlestick; the resistance level is at 1.2645, take profit is at 1.2721 and stop loss is at 1.2566.
The material has been provided by InstaForex Company - www.instaforex.com