
The pair tested the upper limit of the Bollinger line indicator 1.3587 (black dotted line) and then went down. Moving down, the price tested the historical support level of 1.3481 (blue dotted line). Today, the price may continue its downward movement. As per the economic calendar, news is not expected on Monday.
Trend analysis (Fig.1).
Today, the market from the level of 1.3519 (closing of last Friday's daily candlestick) may continue to move down with the target of 1.3343 - a pullback level of 14.6% (red dotted line). After reaching this lower level, it is possible to work up with the target of 1.3678 - a 76.4% pullback level (yellow dotted line). When testing this line, the continuation of the upward movement is possible with the target of 1.3944 - an 85.4% pullback level (yellow dotted line).
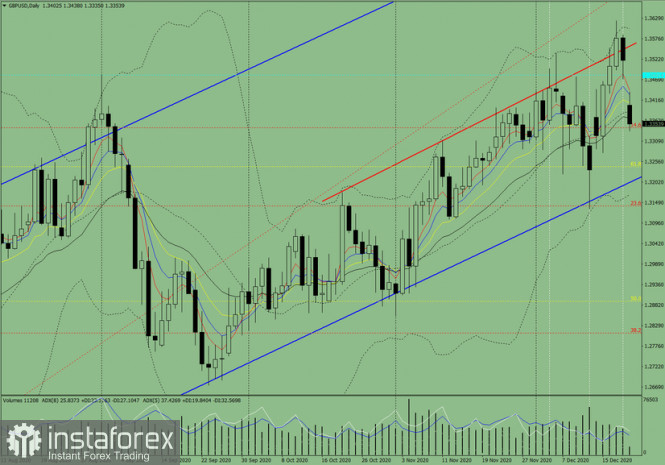
Figure 1 (Daily Chart).
Comprehensive analysis:
- Indicator analysis - up
- Fibonacci levels - up
- Volumes - up
- Candlestick analysis - up
- Trend analysis - up
- Bollinger bands - down
- Weekly chart - up
General conclusion:
Today, the price may continue to move down with the target of 1.3343 - a 14.6% pullback level (red dotted line). After reaching this lower level, it is possible to work up with the target of 1.3678 - a 76.4% pullback level (yellow dotted line). When testing this line, the continuation of the upward movement is possible with the target of 1.3944 - an 85.4% pullback level (yellow dotted line).
Alternative scenario: from the level of 1.3519 (closing of last Friday's daily candlestick), the price may continue to move down with the target of 1.3343 - a 14.6% pullback level (red dotted line). After reaching this lower level, the downward movement may continue with the target of 1.3279 - the lower fractal (daily candlestick from 15.12.2020).
The material has been provided by InstaForex Company - www.instaforex.com