
GBP/USD 5M
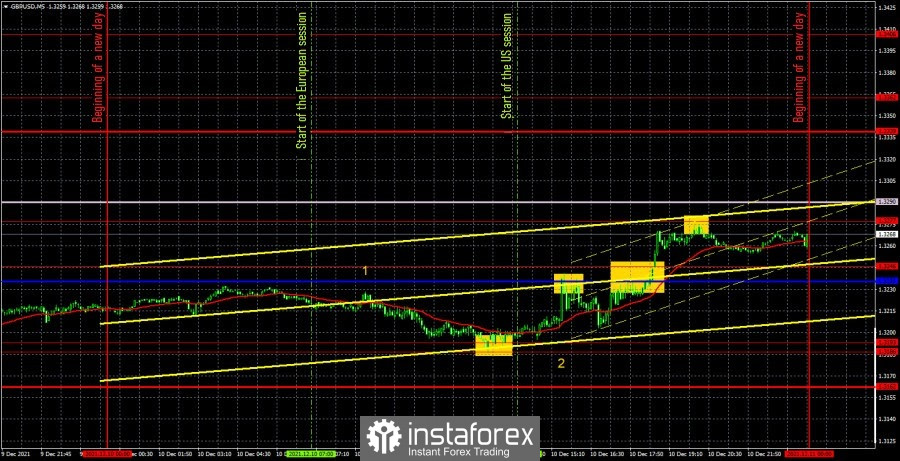
The GBP/USD pair moved much more "softly" in comparison with the jerky movements of the euro/dollar pair on Friday. The pair was slowly decreasing in the first half of the day, and it was growing at about the same rate in the second. There was a surge of emotions among traders for some time immediately after the release of the US inflation report, which led to rather sharp movements. Quite important reports were also published in the morning in the UK - GDP and industrial production - and they turned out to be worse than forecasted, so it is not surprising that the pound fell in the first half of the day. Unfortunately, this movement did not work out, since not a single signal was generated in the morning. It fell short of reaching the critical line by a couple of few points, from which it could rebound. But a buy signal was formed at the end of the European trading session, when there was a rebound from the 1.3186-1.3193 area. Its traders had to work out a long position. The US inflation report was published a little later, about an hour later, and, since the deal had already been opened, and the movement could be strong, it was necessary to set Stop Loss below the 1.3186-1.3193 area. As a result, the pair reached the Kijun-sen line and bounced off it, so the long position should have been closed (profit was 27 points) and a short position immediately opened. This signal turned out to be false, and we saw a decline by more than 20 points, so the Stop Loss was set at breakeven, at which the deal was closed. A new buy signal was formed when the pair overcame the Kijun-Sen at the 1.3246 area. This signal brought about 20 points of profit, and the trade should have been closed after a rebound from the level of 1.3277. As a result, the profit of the day was almost 50 points.
GBP/USD 1H
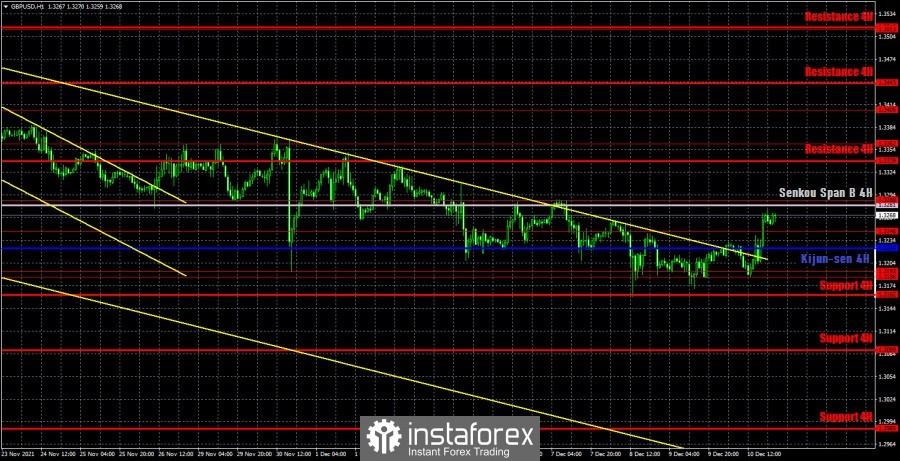
On the hourly timeframe, the pound/dollar pair broke out of the descending channel, so now a new upward trend can begin to form. The bulls only have to overcome the important Senkou Span B line on their way, and then the chances of further upward movement will become even greater. However, this week the results of the meetings of the Bank of England and the Federal Reserve will be summed up, so the mood of traders may change dramatically. We highlight the following important levels on December 13: 1.3186-1.3193, 1.3246, 1.3288, 1.3362, 1.3406. There are no levels below, as the price has not been so low for more than a year. The Senkou Span B (1.3224) and Kijun-sen (1.3281) lines can also be signal sources. Signals can be "rebounds" and "breakthroughs" of these levels and lines. It is recommended to set the Stop Loss level to breakeven when the price passes in the right direction by 20 points. The lines of the Ichimoku indicator can move during the day, which should be taken into account when searching for trading signals. BoE Chairman Andrew Bailey will give a speech in the UK on Monday. However, we do not believe that three days before the central bank meeting, its head will share important information with the markets. Thus, today, most likely, there will be no news, and the volatility of the pair will be relatively weak.
We recommend you to familiarize yourself:
Overview of the EUR/USD pair. December 13. The markets have been lying low for a week and are waiting for the outcome of the Fed meeting.
Overview of the GBP/USD pair. December 13. The market does not believe that the Bank of England will raise the rate.
Forecast and trading signals for EUR/USD for December 13. Detailed analysis of the movement of the pair and trade deals.
COT report
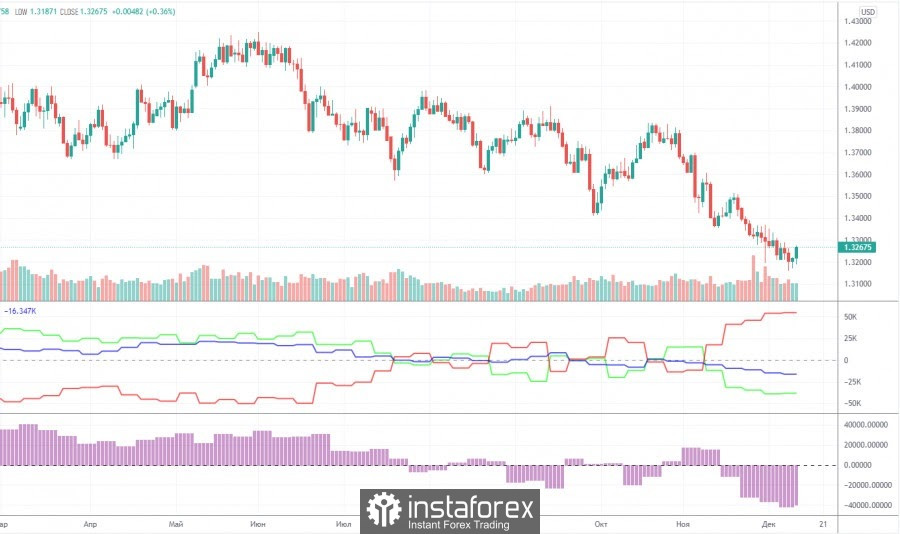
The mood of professional traders became a little less bearish during the last reporting week (November 30 – December 6). Professional traders closed 3,600 sell contracts (shorts) and 2,100 buy contracts (longs) during the week. Thus, the net position for the "non-commercial" group of traders increased by 1,500 contracts. This is a very small change even for the British pound. In general, the mood of non-commercial traders continues to be bearish, and quite strong. We draw your attention to how low the green line of the first indicator is located in the chart above, which reflects the net position of the non-commercial group. Thus, unlike the euro, the pound's decline in recent weeks looks just logical: major players sell off the currency, and it falls. A further decline in the British currency is also now quite likely, but at the same time we draw your attention to the fact that the green and red lines of the first indicator have moved quite far from each other. This may indicate that the downward trend is drying up. Thus, we get a situation in which the euro currency is not moving down quite logically, and the pound may complete its movement in the near future. Thus, for both major pairs, we recommend waiting for the downward trend to end, but do not start buying until specific buy signals are formed.
Explanations for the chart:
Support and Resistance Levels are the levels that serve as targets when buying or selling the pair. You can place Take Profit near these levels.
Kijun-sen and Senkou Span B lines are lines of the Ichimoku indicator transferred to the hourly timeframe from the 4-hour one.
Support and resistance areas are areas from which the price has repeatedly rebounded off.
Yellow lines are trend lines, trend channels and any other technical patterns.
Indicator 1 on the COT charts is the size of the net position of each category of traders.
Indicator 2 on the COT charts is the size of the net position for the non-commercial group.
The material has been provided by InstaForex Company - www.instaforex.com