
Last Friday, the pair moved from the pullback level of 85.4% at 1.2275 (yellow dotted line) then went down, testing the historical support level at 1.2234 (blue dotted line). The pair closed the day at 1.2254. Today, the price may continue to move up. News on the market is not expected today.
Trend analysis (Figure 1).
Today, from the level of 1.2254 (the closing of Friday's daily candle), the market may move down and test the support line of 1.2275 (blue bold line) before moving up with the upper target of 1.2275 which is a pullback level of 85.4% (yellow dotted line). In the case of testing this upper level, we can continue to work up with the target of 1.2462 which is the historical resistance level (blue dotted line).
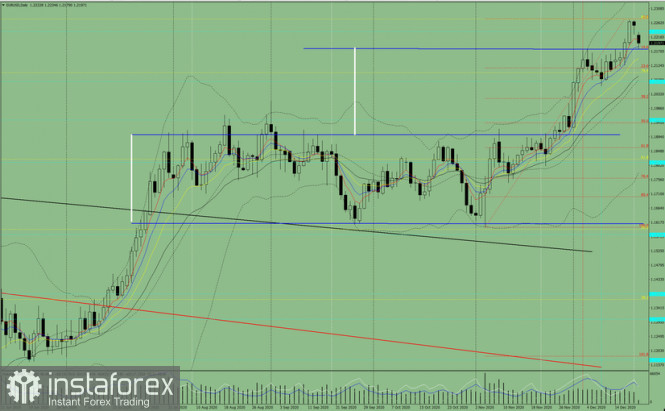
Figure 1 (daily chart).
Comprehensive Analysis:
- Indicator Analysis – up
- Fibonacci Levels – up
- Volumes – up
- Candle Analysis – up
- Trend Analysis – up
- Bollinger Bands – up
- Weekly Chart – up
General conclusion:
Today, from the level of 1.2254 (the closing of Friday's daily candle), the price may move down and test the support line of 1.2275 (blue bold line) before continuing to move up with the upper target of 1.2275 which is a pullback level of 85.4% (yellow dotted line). In the case of testing this upper level, we can continue to work up with the target of 1.2462 which is the historical resistance level (blue dotted line).
Alternative scenario: From the level of 1.2254 (the closing of the Friday's daily candle), we can work down to reach the pullback level of 14.6% at 1.2093 (red dotted line). In case of testing this level, continue working down with the target of 1.2117 which is a pullback level of 23.6% (red dotted line).
The material has been provided by InstaForex Company - www.instaforex.com