
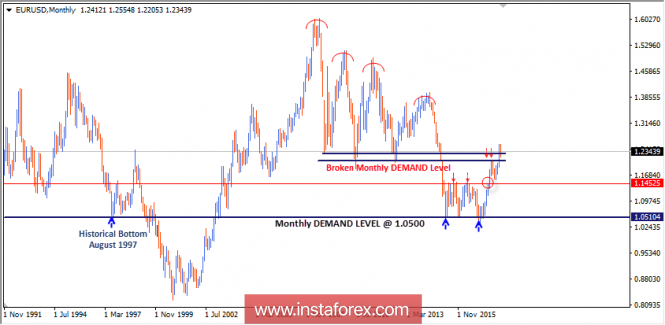
Monthly Outlook
In January 2015, the EUR/USD pair moved below the major demand levels near 1.2050-1.2100 (multiple previous bottoms set in July 2012 and June 2010). Hence, a long-term bearish target was projected toward 0.9450.
In March 2015, EUR/USD bears challenged the monthly demand level around 1.0500, which had been previously reached in August 1997.
In the longer term, the level of 0.9450 remains a projected target if any monthly candlestick achieves bearish closure below the depicted monthly demand level of 1.0500.
However, the EUR/USD pair has been trapped within the depicted consolidation range (1.0500-1.1450) until the current bullish breakout was executed above 1.1450 and recently above 1.2075.
Another bullish breakout above 1.2250 was expressed on the chart. This hinders the bearish momentum allowing bullish advancement to occur towards 1.2750 provided that the price level of 1.2250 remains defended by the bulls.
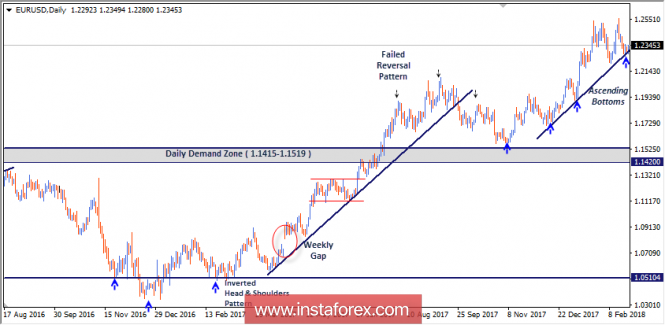
Daily Outlook
In September, a bearish target for the depicted Head and Shoulders pattern was projected towards 1.1350. However, the market failed to apply significant bearish pressure against the mentioned zone (1.1415-1.1520).
Instead, In November, evident bullish recovery was manifested around the price zone of 1.1520-1.1415.
This hindered further bearish decline which allowed the current bullish momentum to occur towards the price level of 1.2100 which failed to pause the ongoing bullish momentum as well.
Daily persistence above 1.2470-1.2500 is needed to confirm a recent bullish flag continuation pattern with projected targets around the price level of 1.2750.
On the other hand, a recent bearish pullback is being expressed below the price level of 1.2450 thus expressing a double-top reversal pattern with a projected target around 1.1990.
The current bearish pullback may extend towards 1.2070-1.1990 (reversal pattern projection targets) if a bearish breakdown of the level of 1.2200 (the depicted uptrend line) is achieved on a daily basis.
The material has been provided by InstaForex Company - www.instaforex.com