MG Network

something big isHappening!

In the mean time you can connect with us with via:

Copyright © Money Grows Network | Theme By Gooyaabi Templates

Money Grows Network

Archive

Powered by Blogger.

Welcome To Money Grows Network

Verified By

2006 - 2019 © www.moneygrows.net

Investments in financial products are subject to market risk. Some financial products, such as currency exchange, are highly speculative and any investment should only be done with risk capital. Prices rise and fall and past performance is no assurance of future performance. This website is an information site only.

Popular

Pages

Expert In

Name*


Message*

Ichimoku cloud indicator analysis of gold for February 26, 2018

The Gold price has broken through the 4-hour cloud resistance and is now trading inside the Kumo (cloud). The trend is now neutral. Bulls need to break above the cloud resistance in order to change trend to bullish again.

analytics5a93b93a1dd30.png

The Gold is trading above both the tenkan- and the kijun-sen in the 4-hour chart. Short-term support is on Friday's low at $1,325. A break below that level will be a bearish sign. A break below $1,325 will most probably push Gold towards $1,300 or lower. Resistance is at $1,345. Break above it and we could see another run towards $1,350 where we find the long-term resistance area. So far bulls have the upper hand if we take under consideration the fact that Gold has made a higher low relative to the early February low at $1,307.

analytics5a93b9fbc84b9.png

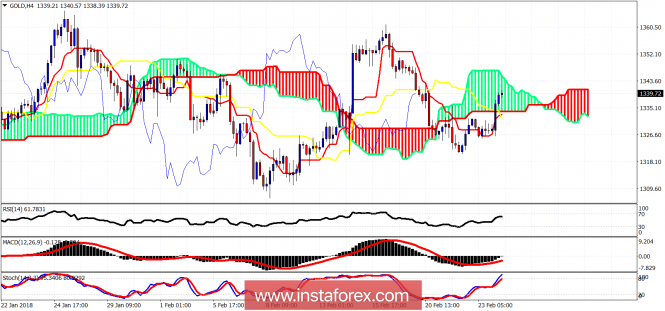
Magenta line - long-term resistance

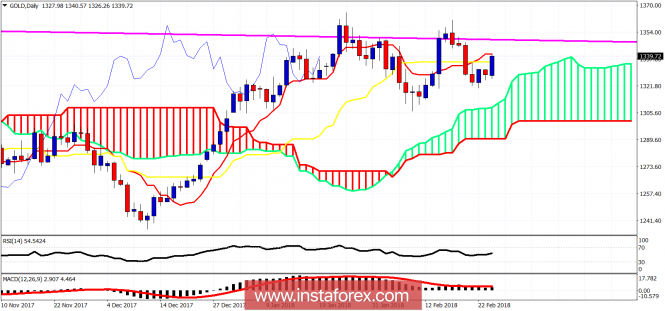
On a daily basis, Gold price remains above the daily Kumo and is trying to break above the tenkan-sen. Gold price has important long-term resistance in the $1,350-60 area and if it manages to move towards that level again, it will most probably break above it and move towards $1,400. For now, the trend favors bulls. Only a break below $1,320-$1,300 could change the trend.

The material has been provided by InstaForex Company - www.instaforex.com