
The pair still hovers around the 200 SMA, having found support around the 1.3860 level. There is no clear path for the short-term in GBP/USD, as the bulls lost steam in the February 16th highs and bears are no strong enough to push it lower. If the 1.3939 level gives up, the next target would be the 1.3753 level. MACD indicator remains in the negative territory.
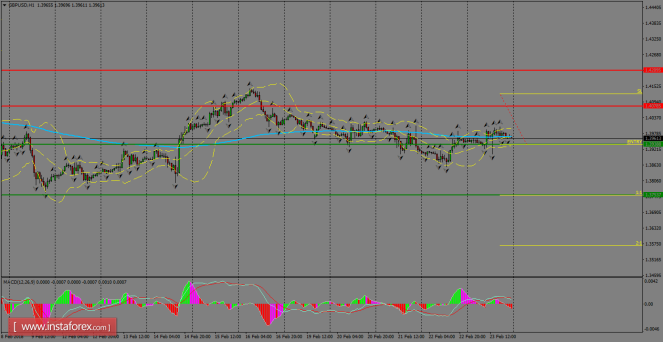
H1 chart's resistance levels: 1.4078 / 1.4209
H1 chart's support levels: 1.3939 / 1.3753
Trading recommendations for today: Based on the H1 chart, sell (short) orders only if the GBP/USD pair breaks a bearish candlestick; the resistance level is at 1.3939, take profit is at 1.3753 and stop loss is at 1.4130.
The material has been provided by InstaForex Company - www.instaforex.com