
The US dollar index is pulling back towards cloud support. The index got rejected at 90 and is now testing the 89.60 level. The inability to break above the 90.60 level was not a good sign for bulls and something that we warned about. For confirmation of a bigger trend reversal and that the entire downward move from 103.60 is over, the index must break above 90.60. It did not happen.
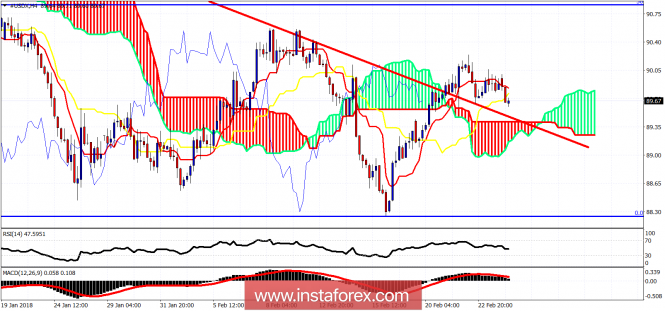
The US dollar index is trading above the Ichimoku cloud on the 4-hour chart. Support is at 89.45-89.35. The 61.8% Fibonacci retracement of the rise from February lows is at 89. So this is the last line of defense for dollar bulls. On the other hand, the key resistance remains at 90.60.
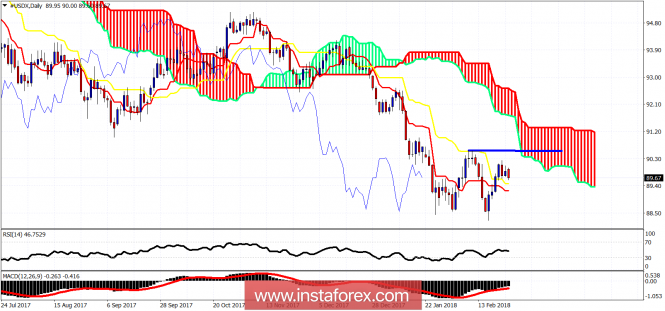
Bears, on the other hand, need to defend the 90.60 level and continue trading below the daily cloud as shown above. The trend remains bearish on the daily chart. Support on the daily chart is at 89.25 so a daily close below it will be a bearish sign. The risk reward of a bearish trade is more favorable now than a long trade.
The material has been provided by InstaForex Company - www.instaforex.com