
Well, it's time to sum up the results of the weekly trading on June 22-26 and forecast the development of events in the opening weekly trading session.
First of all, it is worth noting that at the trading of the past five days, the US dollar showed mixed dynamics concerning its main competitors.
As noted earlier, the main reason for the strengthening of the US dollar was the outbreak of the second wave of COVID-19 in the US states of Texas, Arizona, California, Florida, and Mississippi. The epidemiological situation remains difficult in Brazil, Mexico, India, as well as in some European countries, which were spared the first outbreak of the pandemic. There has been a sharp increase in the daily number of COVID-19 diseases.
In addition to the epidemic of a new type of coronavirus infection, investors were concerned about the escalated trade and political (Hong Kong) standoff between the United States and China, as well as tensions in trade relations between the United States and the European Union. Let me remind you that the White House administration is seriously considering increasing tariffs on goods from the EU's leading economically developed countries. It should also be noted that the International Monetary Fund (IMF) has further lowered its forecasts for world economic growth this year.
Given all these factors, as well as the gradual recovery of the US economy, I would venture to assume that the US dollar will continue to enjoy increased demand from market participants as a protective asset. Let's see what the situation is on the price charts of the euro/dollar currency pair and start with the weekly timeframe.
Weekly
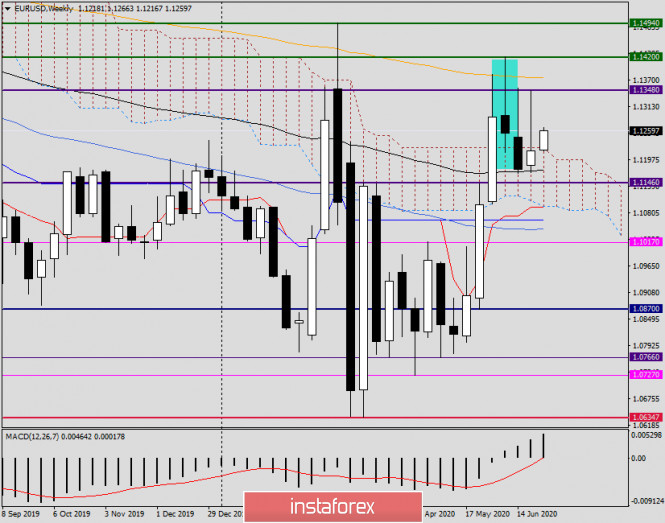
Last week's trading started for the main currency pair on a positive note. As a result of the initial growth, the quote rose to 1.1348, after which there was a change in price dynamics. The level of 1.1350 has been noted as technically very strong more than once. This mark has repeatedly influenced the euro/dollar exchange rate. This pattern was confirmed during the trading last week.
Now let's pay attention to the last weekly candle. First, it has formed a very long upper shadow, which may indicate the end of the upward dynamics. Secondly, last week's trading ended within the cloud of the Ichimoku indicator, which also can not be considered a positive factor for players to increase the rate. Most often, after the formation of such candles, there is a decrease in the exchange rate. At the same time, I do not exclude attempts to once again bring the price up from the Ichimoku cloud, which most likely will not be successful. And another important point. Above the upper border of the cloud, only two weekly candles were closed, and for true consolidation, it was necessary to close three. On this basis, the upward exit from the cloud can be considered invalid or false.
Now, to regain control of the main currency pair, the bulls need to overcome many significant resistances. After the quote is withdrawn up from the Ichimoku cloud, it is necessary to break through the strong resistance of sellers in the area of 1.1348-1.1353, pass up the 200 EMA, which is located at 1.1376, and then overcome the resistance at 1.1383, 1.1422 and 1.1494. Only after a true breakdown of the last mark and fixing above the most important psychological level of 1.1500, we can consider the market for euro/dollar bullish and expect further growth of the main currency pair. I would like to point out that these are very difficult tasks, and the market mood must change dramatically to achieve them.
It is more likely to assume a bearish scenario, which will confirm the breakdown of the 89 EMA (black) and the pair's exit down from the cloud. With this development, the nearest targets of sellers will be the Tenkan line (1.094), Kijun (1.1065), and 50 MA, which runs at 1.1044. At the same time, it is worth noting that near each of the indicated targets of a likely decline, the euro/dollar may find strong support and turn up. Or at least try to do it. In other words, from the price zone of 1.094-1.1044, there may be at least a rebound up.
In general, the situation for EUR/USD is extremely interesting and equally uncertain for positioning.
Today, after Friday's closing of weekly trading, I will only focus on the relevant timeframe, according to which, the bearish scenario has the greatest chances for its implementation. All the resistances listed in this article, as well as lower prices in the area of 1.1240-1.1260, can be considered benchmarks for opening short positions.
We will discuss the situation in more detail in the remaining periods in the next article. Regarding today's economic calendar, you can pay attention to data from the Eurozone on indices of economic sentiment, consumer confidence, and business optimism in the industrial sector. All these indices will be published at 10:00 (London time). A little later, at 13:00 (London time), Germany will inform market participants about changes in consumer prices. From the American statistics today, only data on unfinished transactions for the sale of housing can be distinguished, which will be published at 15:00 London time.
Good luck with trading!
The material has been provided by InstaForex Company - www.instaforex.com