
4-hour timeframe
Technical data:
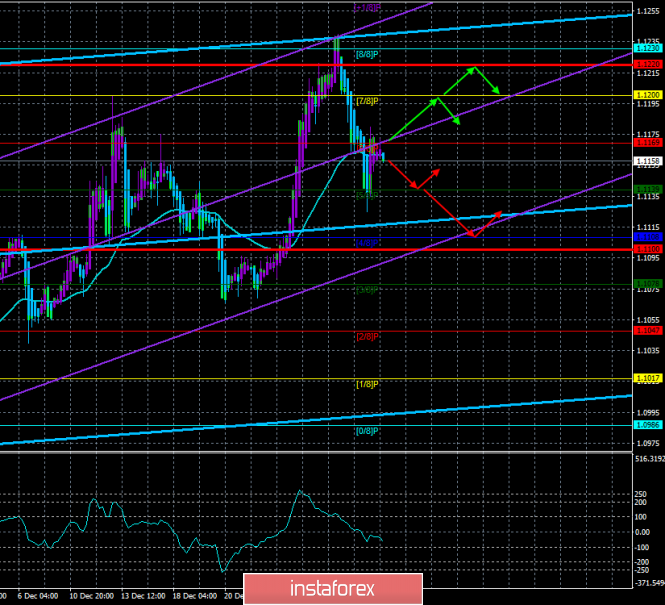
The upper channel of linear regression: direction - up.
The lower channel of linear regression: direction - up.
The moving average (20; smoothed) - sideways.
CCI: -59.5968
A new trading week begins for the EUR/USD currency pair. And it begins with expectations of a new fall in the European currency. We have already said in previous reviews that most of the fundamental and technical factors now lie on the side of the US currency, and even a very weak index of business activity in the US manufacturing sector ISM did not cause any panic in the market and did not lead to a strong fall in the US dollar. Thus, Friday's correction can be interpreted as a correction and, accordingly, the main downward movement can be resumed today. Moreover, traders were not able to confidently overcome the moving average line and the Murray level of "6/8". Thus, a rebound from these two resistances may trigger a resumption of the downward trend.
As for the macroeconomic component, on the first trading day of the week, several quite interesting, but essentially secondary reports will be published at once. For example, retail sales in Germany, which may be interesting in themselves, but are unlikely to cause at least some reaction from traders. It is about the same with the indices of business activity in the services sectors of the EU countries and the EU as a whole. These indicators are confidently located above the level of 50.0, so there are no concerns. Only the British index in the services sector is below the key mark of 50.0, but this is in the article on GBP/USD. In the States, after lunch, there will also be published indexes of business activity in the service sector and composite, which are also confidently located above 50.0. Thus, the market reaction to a whole pile of business activity indices will follow only if one or more of them frankly fail or significantly exceed the forecast values.
Meanwhile, currency traders continue to wonder how the military conflict between the United States and Iran may affect the world economy. In itself, a military conflict is nothing good, especially since the parties have not calmed down. Iran threatened to take revenge on America for the slain Colonel Soleimani, to which Trump immediately responded with the following message via Twitter: "Let this serve as a WARNING that if Iran strikes any Americans or American assets, we have targeted 52 Iranian sites (representing the 52 American hostages taken by Iran many years ago), some at a very high level & important to Iran & the Iranian culture, and those targets, and Iran itself, WILL BE HIT VERY FAST AND VERY HARD. The USA wants no more threats!"
At the same time, not all US military officials believe that killing Soleimani was the right move. US intelligence suggested that the option of killing Soleimani should be considered only as of the most extreme step. Some military officials did say that General Soleimani was preparing an attack on US embassies and consulates in Syria, Iraq, and Lebanon. However, other officials expressed skepticism that the Iranian General was planning anything like this at all. A senior official said that the situation in the Middle East as of December 30 was normal, and there was nothing unusual about Soleimani's movements. However, all this is a lyric. The most important thing that the whole world can face now is a military conflict and terrorist attacks. I want to believe that it will do without this, but it is unlikely that Iran will leave the murder of its General without an answer.
The technical picture of the euro-dollar currency pair now suggests a resumption of the downward movement after a small correction. The dollar still has everything you need to continue to rise in price. However, Trump's actions in the Middle East may discourage traders from buying the US currency for a while. Thus, overcoming the Murray level of "6/8" - 1.1169 can return the bulls to the currency market.
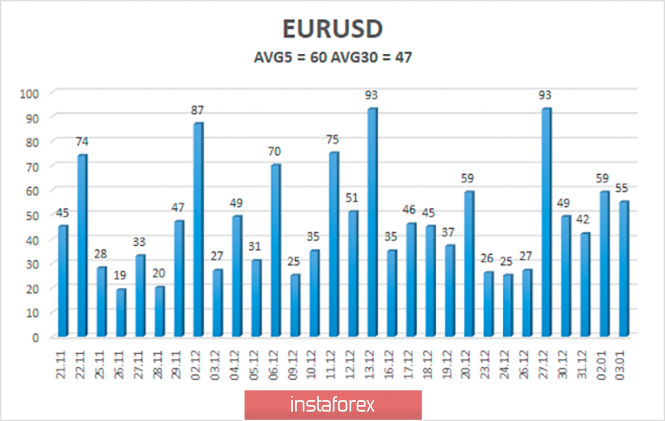
The average volatility of the euro-dollar currency pair is now 60 points, which is the average value for the euro. Thus, we have volatility levels on January 6 - 1.1100 and 1.1220. The reversal of the Heiken Ashi indicator downwards will indicate the resumption of the downward movement to the lower border of the volatility channel.
Nearest support levels:
S1 - 1.1139
S2 - 1.1108
S3 - 1.1078
Nearest resistance levels:
R1 - 1.1169
R2 - 1.1200
R3 - 1.1230
Trading recommendations:
The euro-dollar pair is currently being adjusted. Thus, it is recommended to wait for its completion, and then start trading on the downside with the targets of 1.1139 and 1.1108. The general fundamental background remains not in favor of the euro, so the fall of the pair is more preferable. It is recommended to return to buying the euro-dollar pair only if the moving and Murray level of 1.1169 is successfully overcome with the first targets of 1.1200 and 1.1220.
In addition to the technical picture, you should also take into account the fundamental data and the time of their release.
Explanation of the illustrations:
The upper channel of linear regression - the blue lines of the unidirectional movement.
The lower channel of linear regression - the purple line of the unidirectional movement.
CCI - the blue line in the indicator window.
The moving average (20; smoothed) - the blue line on the price chart.
Murray levels - multi-colored horizontal stripes.
Heiken Ashi - an indicator that colors bars in blue or purple.
Possible variants of the price movement:
Red and green arrows.
The material has been provided by InstaForex Company - www.instaforex.com