
Trend analysis.
This week, the price will move up with the first target of 1.1239 - the upper fractal. If you break through the top of this level, the next top target will be a pullback level of 76.4% - 1.1276 (blue dotted line).
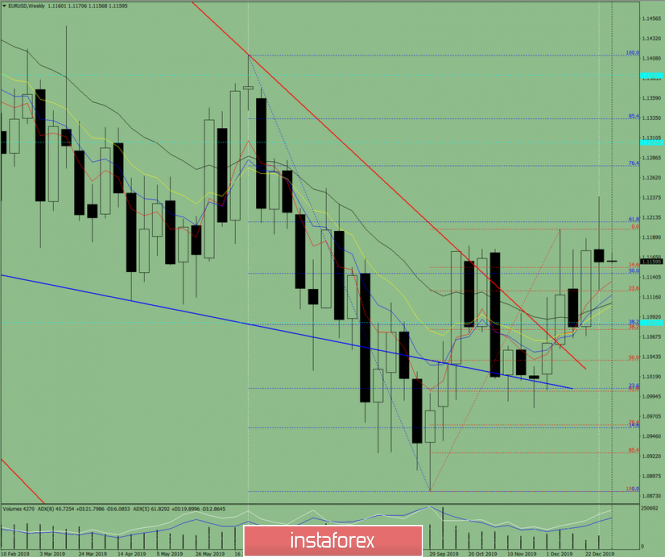
Fig. 1 (weekly chart).
Complex analysis:
- Indicator analysis - up;
- Fibonacci levels - up;
- Volumes - up;
- Candle analysis - up;
- Trend analysis - up;
- Bollinger lines - up;
- Monthly chart - up.
The conclusion of the complex analysis - an upward movement.
The total result of calculating the candle of the EUR/USD currency pair according to the weekly chart: the price for weeks is more likely to have an upward trend, with the absence of the first lower shadow of the weekly white candlestick (Monday - up) and the absence of the second upper shadow (Friday - up).
Unlikely lower scenario - from the level of 1.1159 (the previous week's close), a downward movement from the first lower target of 1.11123 - a pullback level of 23.6% (red dotted line). If successful, the next lower target of 1.1077 is a pullback level of 38.2% (red dotted line).
The material has been provided by InstaForex Company - www.instaforex.com