
4-hour timeframe
Amplitude of the last 5 days (high-low): 27p - 93p - 49p - 42p - 59p.
Average volatility over the past 5 days: 54p (average).
The first trading week of January 2020 was marked with a negative for the European currency. We have repeatedly said at the end of last year that the euro, as well as the pound, often showed growth when it was not justified by fundamental factors. For example, what were the reasons for the euro's growth from December 26 to December 31? No important macroeconomic reports were published during this period, no important fundamental events took place. Thus, we said in the last days of the past year that in early January, a drop in the euro/dollar pair is very likely. In practice, this happened, and we believe that even despite macroeconomic statistics, the euro will continue to fall for some more time. We also continue to believe that the future of the euro is almost entirely dependent on the United States and macroeconomic statistics from across the ocean. Only if statistics from the US begins to deteriorate again (and you also need some reason for this), will the euro be able to continue to be in demand in the foreign exchange market as it has been in recent weeks. Otherwise, the downward trend will resume sooner or later.
Traders witnessed two positive factors for the euro on Friday, January 3. First, German inflation in December accelerated from 1.1% to 1.5% YOY, which is higher than experts' forecasts and unexpected. Recall that the index of business activity in the manufacturing sector of Germany remains at the level below the plinth. Nevertheless, the consumer price index rose, which gives us hope that European inflation will also show an acceleration in December. This, of course, does not mean that now the euro will spread its wings and the period of weak inflation will be completed. However, this factor may provide local support for the euro. Secondly, the business activity index in the US ISM manufacturing sector also unexpectedly failed, which amounted to only 47.2 in December, while experts predicted growth to 49.0. Such a strong mismatch between the forecast and the real value caused a wave of discontent among dollar bulls and the dollar plummeted on the US trading session on Friday. Collapsed, however, not far, and the fall process did not take much time. The US currency began to grow again near the close of trading on Friday, offsetting most of the 30-point losses. Thus, we can draw several conclusions. Firstly, traders are not too upset because of the weak ISM index. A low value came as a surprise, but no more. Secondly, the general trend for the euro/dollar pair has not changed at all and still assumes a continued downward movement. Thirdly, the general news background has also not changed and remains in favor of the US dollar.
Meanwhile, the world was on the verge of a new military conflict, of course, not without the participation of the United States and Donald Trump personally. On January 3, after the bombing of the international airport in Baghdad, Iranian general Kassem Soleimani was killed. He was killed personally by Trump's order. The Pentagon later explained that Soleimani was developing plans to attack US diplomats in Iraq, and Trump said Soleimani approved the assault on the US Embassy in Baghdad on December 31. Many media outlets immediately suggested that the response would follow immediately and we could say that now the whole world is watching how Iran will respond. Iran's supreme leader said there will be "severe revenge" in response to the killing of Soleimani. So far, such information does not particularly affect the currency market, however, any geopolitical tension can change the desire of most traders to invest in a particular currency. Thus, indirectly, a military conflict between the United States and Iran could affect the dollar. Negatively. And this is another chance for the euro.
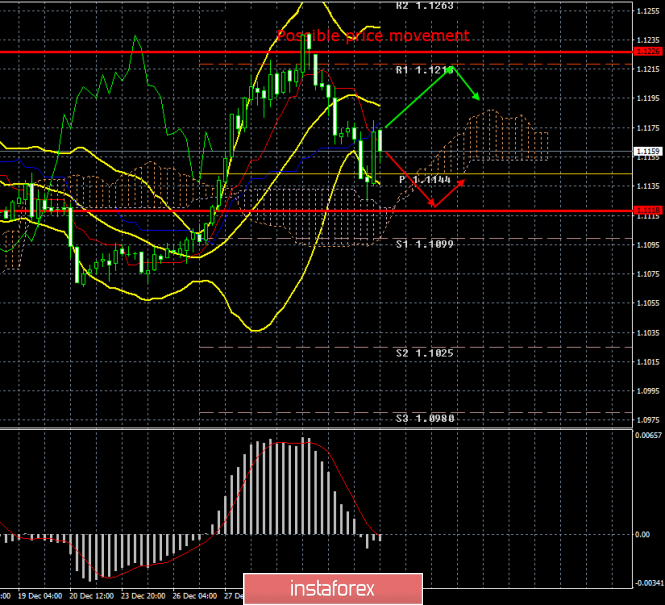
From a technical point of view, the currency pair has already formed a new downward trend, but on Friday an upward correction began, within which the critical Kijun-sen line was worked out. A price rebound from this line may provoke a resumption of the downward movement, and we consider this scenario to be the most probable. In any case, you should now wait until the completion of the current correction and only after that again consider buying the US dollar. If the bulls manage to gain a foothold again above the Kijun-sen line, then the upward trend in the pair may resume, however, from a fundamental point of view, this option is unlikely. Nevertheless, it cannot be completely swept away.
Trading recommendations:
EUR/USD has started a new downward trend. Thus, now it is recommended for traders to wait for the correction to finish and to trade with levels of 1.1118 and 1.1099 as the first goals, however, in small lots, since the current dead cross is still weak. It is recommended to consider buying the pair only in case of breaking the critical line with the first target of 1.1218. All targets, including volatility levels will be specified tomorrow morning.
Explanation of the illustration:
Ichimoku indicator:
Tenkan-sen is the red line.
Kijun-sen is the blue line.
Senkou Span A - light brown dotted line.
Senkou Span B - light purple dashed line.
Chikou Span - green line.
Bollinger Bands Indicator:
3 yellow lines.
MACD indicator:
Red line and bar graph with white bars in the indicators window.
Support / Resistance Classic Levels:
Red and gray dotted lines with price symbols.
Pivot Level:
Yellow solid line.
Volatility Support / Resistance Levels:
Gray dotted lines without price designations.
Possible price movement options:
Red and green arrows.
The material has been provided by InstaForex Company - www.instaforex.com