
Trend analysis.
This week, the price will move down with the first target of 1.2925 - a pullback level of 38.2% (red dotted line). If reached, continue the downward movement with the target of 1.2741 - pullback level of 50.0% (red dotted line).
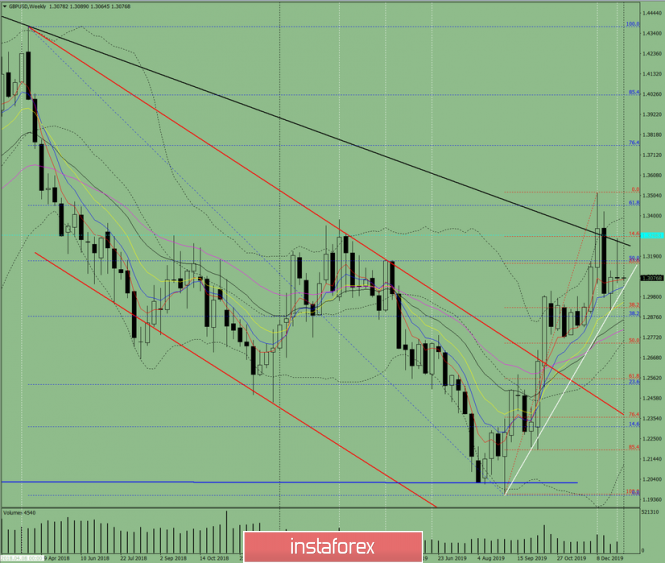
Fig. 1 (weekly chart).
Complex analysis:
- Indicator analysis - down;
- Fibonacci levels - down;
- Volumes - down;
- Candle analysis - neutral;
- Trend analysis - down;
- Bollinger lines - down;
- Monthly chart - up.
The conclusion of the complex analysis - a downward movement.
The overall result of calculating the candle of the GBP/USD currency pair according to the weekly chart: the price for weeks is more likely to have a downward trend with the absence of the first upper shadow of the weekly black candlestick (Monday - down) and the absence of the second lower shadow (Friday - down).
Unlikely scenario - from the support line of 1.3029 (white fat line), work up to the target of 1.3255 - resistance line (black bold line).
The material has been provided by InstaForex Company - www.instaforex.com