
Overview:
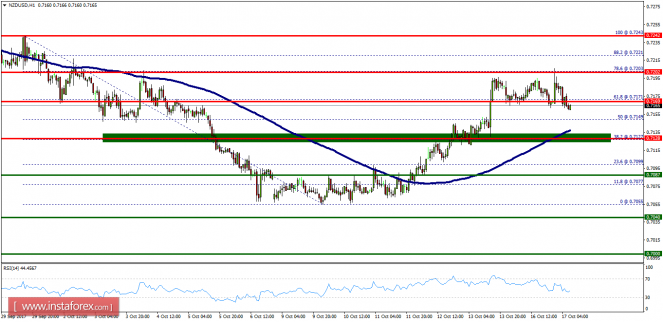
- A weekly pivot point is seen at the price of 0.7128.
- The NZD/USD pair continues to rise from the level of 0.7128 in the long term. It should be noted that the support is established at the level of 0.7128 which represents the 38.2% Fibonacci retracement level on the H1 chart.
- The price is likely to form a double bottom in the same time frame. Accordingly, the NZD/USD pair is showing signs of strength following a breakout of the highest level of 0.7128.
- So, rebuy above the level of 0.7128 with the first target at 0.7171 in order to test the daily resistance 1 and further to 0.7203. Also, it might be noted that the level of 0.7242 is a good place to take profit because it will form a double top.
- However, in case a reversal takes place and the NZD/USD pair breaks through the support level of 0.7128/0.7087, a further decline to 0.7055 can occur which would indicate a bearish market.