
GBP/USD is looking to correct the last week's rally as the resistance zone of 1.3309 is capping gains in the pair. The 200 SMA at H1 chart could act as dynamic support, but if it gives up, we might expect a leg lower to test the support area of 1.3216. MACD indicator remains in the negative territory and it should be an indication that bears could re-take the control of the Cable.
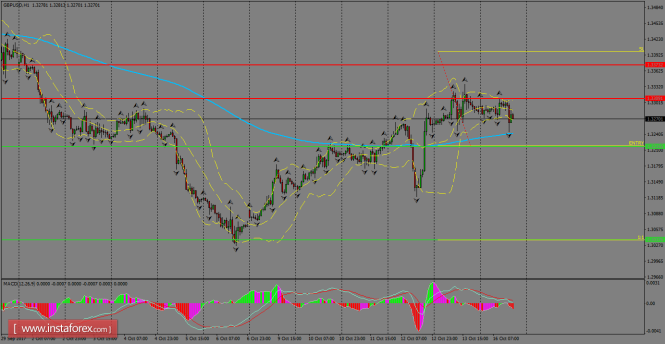
H1 chart's resistance levels: 1.3309 / 1.3373
H1 chart's support levels: 1.3216 / 1.3037
Trading recommendations for today: Based on the H1 chart, sell (short) orders only if the GBP/USD pair breaks a bearish candlestick; the support level is at 1.3216, take profit is at 1.3037 and stop loss is at 1.3398.
The material has been provided by InstaForex Company - www.instaforex.com