
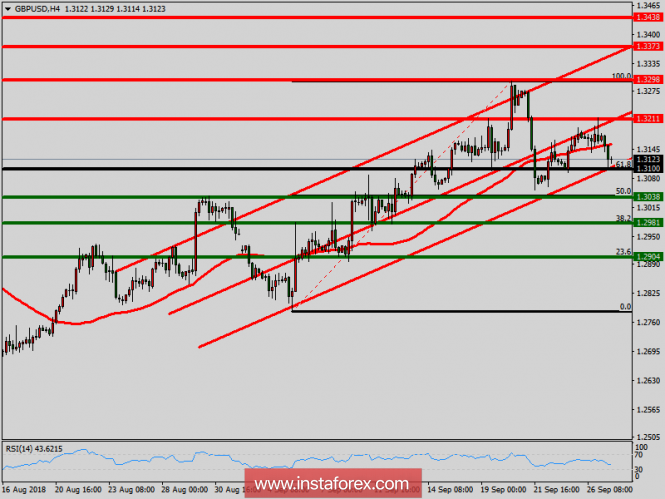
The GBP/USD pair rose from the level of 1.3100 towards 1.3211 yesterday. Now, the current price is set at 1.3119. On the H4 chart, the resistance is seen at the levels of 1.3211 and 1.3298. Besides, the weekly support 1 is seen at the level of 1.3038. Today, the GBP/USD pair is continuing to move in a bullish trend from the new support level of 1.3100 (pivot), to form a bullish channel. Amid the previous events, we expect the pair to move between 1.3100 and 1.3298 in coming hours. Therefore, buy above the level of 1.3100 with the first target at 1.3211 in order to test the daily resistance 1 and further to 1.3298 (double top). Nevertheless, if the pair fails to pass through the level of 1.3298, the market will indicate a bearish opportunity below the level of 1.3298. The market will decline further to 1.3100 in order to return to the weekly pivot point. Additionally, a breakout of that target will move the pair further downwards to 1.3038.
Comment:
- The weekly pivot is seen at the level of 1.3100.
- The market is still in an uptrend. We still prefer the bullish scenario.
The material has been provided by InstaForex Company - www.instaforex.com