
To open long positions for EURUSD, it is required:
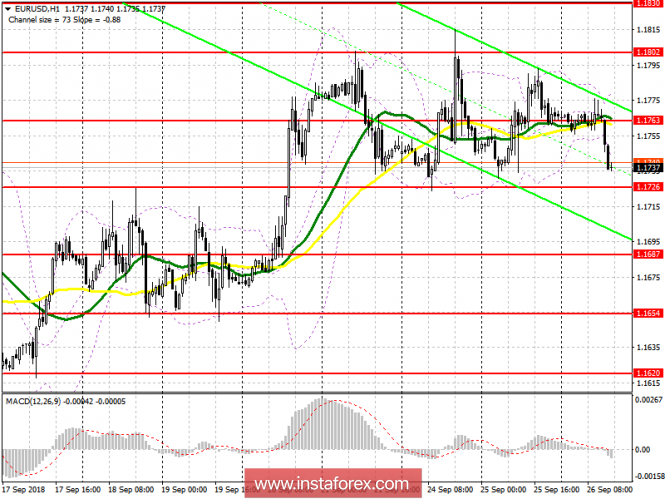
Buyers of the euro will show themselves after the decline and update of a large support level of 1.1726, for which the entire calculation is done and which further depends on the ascending trend. The breakthrough of the level of 1.1726 on the Fed's decision may be temporary, so the formation of a false breakout on it, after the announcement of the rate, will be an additional signal to buy the euro in order to return to 1.1763 and update 1.1802. The demolition of stop orders of sellers above 1.1802 will resume the upward trend in the EUR/USD pair, which will lead to an increase in the area of 1.1830 and 1.1866, where I recommend to lock in profit.
To open short positions for EURUSD, it is required:
The sellers got close to the support level of 1.1726, but it will be possible to talk about its real breakout after the publication of the Fed's decision, which will lead to a temporary growth of the US dollar and the exit to the lows of 1.1687 and 1.1654, the update of which will break the uptrend in the euro. In case the EUR/USD pair increases in the second half of the day, it is best to return to selling from the high of the week at 1.1802, on a false breakout, or a rebound from a large resistance of 1.1866.
Indicator signals:
Moving averages
The 30-day moving average is at the same level as the 50-day average, which indicates the lateral nature of the market. The trade moved below the moving averages, indicating a likely continuation of the euro's decline.
Bollinger Bands
Bollinger bands have narrowed, indicating a drop in market volatility before the release of important fundamental data.
Indicator description
- Moving Average (average sliding) 50 days - yellow
- Moving Average (average sliding) 30 days - green
- MACD: fast EMA 12, slow EMA 26, SMA 9
- Bollinger Bands 20