
EUR/USD has bounced towards the important resistance of 1.1730-1.1760 once again. We warned about the bullish divergence signs last week and that a bounce towards the upper triangle boundary was very possible. The EUR/USD pair has reached this resistance again.
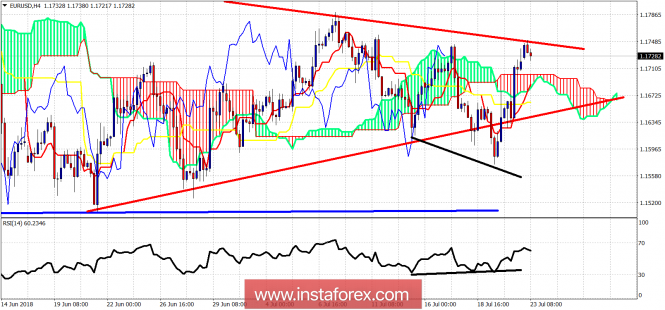
Red lines - triangle pattern
Blue line - major support
Black lines - bullish divergence
The EUR/USD has broken above the 4 hour Ichimoku cloud. The bullish divergence played out very fast as the price recovered its losses. However, the price is still below the major resistance area of 1.1730-1.1760. Only if we clear above this area we will see a sustained rally towards 1.19-1.20 or even higher. Support is at 1.17 and at 1.1660-1.1640. If we break below the red trend line support once again, we will have to take a closer look at the RSI if it holds above its previous lows. If the RSI breaks below the black trend line support, we should expect EUR/USD to break below 1.16 once again.
The material has been provided by InstaForex Company - www.instaforex.com