
Technical outlook:
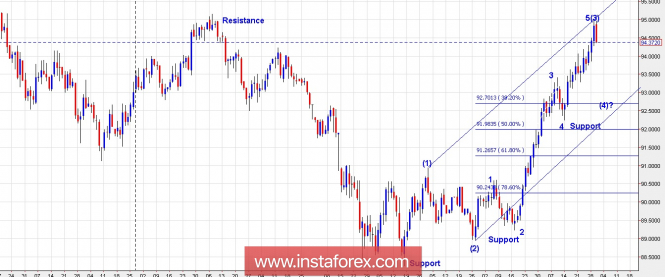
The US Dollar Index almost takes out resistance at 95.00 levels before giving in to bears yesterday. As seen on the daily chart presented here, the index is forming an engulfing bearish candlestick pattern and should be looking to drop lower at least through 92.70 levels going forward. Please note that the fibonacci 0.382% support is where we are expecting prices to form a higher low, before resuming its uptrend. Looking into the wave counts, the index seems to have terminated its wave (3) as seen here and should begin its corrective phase lower, to terminate into wave (4). As to the time frame, we expect wave (4) termination around June 04-06, before wave (5) can again resume higher into the 98.00 region. Also note that the channel line support is also coming around the same support levels for now.
Trading plan:
Aggressive traders might want to remain short with stop above 95.00, targeting 92.50/70 levels respectively.
Fundamental outlook:
Watch out for German Consumer price index at 08:00 AM EST and US GDP Annualized at 08:30 AM EST.
Good luck!
The material has been provided by InstaForex Company - www.instaforex.com