
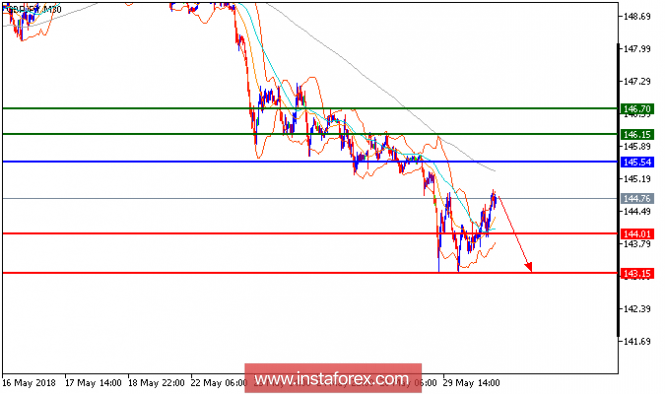
All our downside targets which we predicted in yesterday's analysis have been hit. The pair is in a downward trend, capped by its negative trend line. Both the 20-period and 50-period simple moving average are heading downward, calling for a further decline. Furthermore, the relative strength index remains weak below its neutrality area at 50. To conclude, as long as 145.55 is not surpassed, likely decline to 144.00 and 143.15 in extension.
Chart Explanation: The black line shows the pivot point. Currently, the price is above the pivot point which is a signal for long positions. If it remains below the pivot point, it will indicate short positions. The red lines show the support levels, while the green line indicates the resistance levels. These levels can be used to enter and exit trades.
Resistance levels: 145.75, 146.55, and 147.10
Support levels: 144, 143.00, and 142.50
The material has been provided by InstaForex Company - www.instaforex.com