
Technical Outlook :
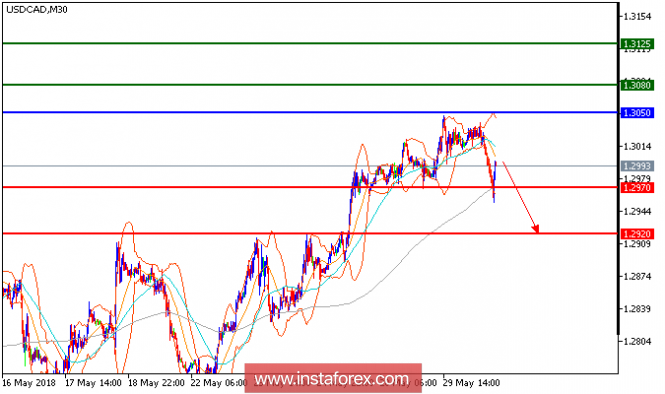
USD/CAD is expected to trade with a bearish outlook. The pair broke below its lower boundary of Bollinger Bands, indicating the downside acceleration. Both bearish 20-period and 50-period moving averages should push the prices lower. The relative strength index broke below its oversold level of 30, but has not displayed any reversal signal. Therefore, below 1.3050, look for a new test with targets at 1.2970 and 1.2920 in extension.
Fundamentals:
Canadian producer prices rose for a fourth straight month in April amid higher energy prices, and the country's raw-materials price index also advanced. Canada's industrial product price index rose 0.5% in April, Statistics Canada said Wednesday, following a 0.9% gain in the previous month. Market expectations were for a 0.6% increase in April, according to economists at Royal Bank of Canada. The index measures the price manufacturers in Canada receive once their goods leave the plant. It doesn't reflect the final prices consumers pay for goods on store shelves.
Chart Explanation: The black line shows the pivot point. Currently, the price is above the pivot point which is a signal for long positions. If it remains below the pivot point, it will indicate short positions. The red lines show the support levels, while the green line indicates the resistance levels. These levels can be used to enter and exit trades.
Resistance levels: 1.3050, 1.3080, and 1.3145
Support levels: 1.2970, 1.2920, and 1.2890
The material has been provided by InstaForex Company - www.instaforex.com