
4-hour timeframe
Technical details:
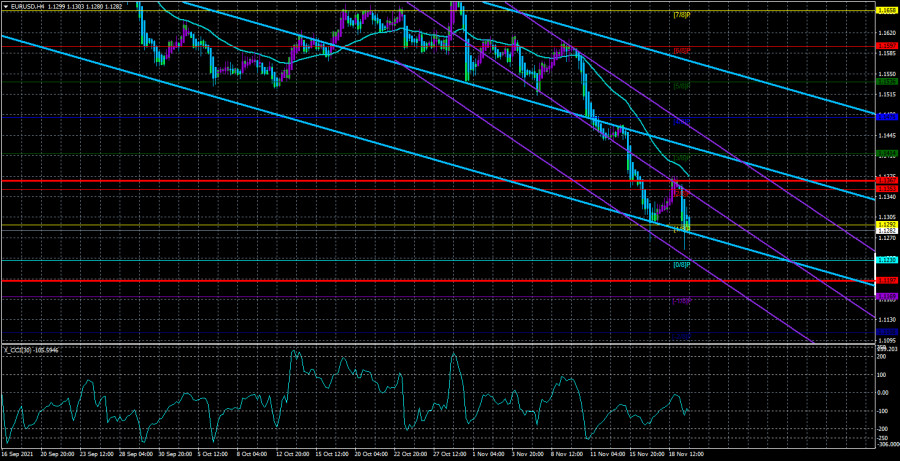
Higher linear regression channel: direction - downward.
Lower linear regression channel: direction - downward.
Moving average (20; smoothed) - downward.
The EUR/USD currency pair sharply and unexpectedly resumed falling on Friday. "Unexpectedly" - because no important events and macroeconomic publications were scheduled for November 19. We deliberately do not attribute the speeches of ECB President Christine Lagarde to important events simply because she spoke 6 times in total last week. Hardly anyone expected that Christine Lagarde would discourage and surprise the markets at every speech. Although, by and large, almost every one of her speeches provoked the fall of the European currency. It's simple - all week Christine Lagarde has been saying that monetary policy will not tighten, rates will not rise, the EU economy is still too weak, and inflation will begin to slow down by itself, but later. Such "ultra-deep" comments could have been completely ignored by the markets because Lagarde's rhetoric has not changed in recent months and all this has already been heard from her mouth one way or another. However, in the last two weeks, the European currency has been frankly falling, so the bears do not need much now for them to continue selling the pair. Here is such a combination of circumstances. Of course, we should not forget that at this time, another "wave" of the pandemic is raging in the European Union. And this time it's not just about the increase in the number of diseases, but also about new "lockdowns" in European countries. And the "lockdowns" are a blow to the EU economy, which is not feeling too well anyway, which is confirmed by the GDP data for the last 4 quarters. Consequently, quite unexpectedly, in just a few weeks, the fundamental background changed from "practically neutral" to "sharply negative" for the euro currency. This is what caused the powerful fall of the euro/dollar pair, which may continue and break the global technical picture.
The more the euro falls, the more likely it is to fall further.
On the 4-hour timeframe, the trend remains downward, which is seen in the illustration above. Moreover, in the last couple of weeks, the pair has finally started to move as expected. Recall that in the last 4-5 months, volatility averaged 40-50 points per day, and the price at the same time showed such movements. Nevertheless, it was very difficult to trade in a movement that is very similar to a flat and lasts 4 days out of 5. Therefore, now in some way, there is a holiday on the street of traders. You can see in the illustration below exactly how volatility has increased in recent weeks. However, along with this, the technical picture on the 24-hour timeframe almost broke down. Recall that for a long time, we expected the completion of the downward movement of the pair, as we considered it a correction against the global upward trend of 2020. However, this correction, which can still be considered a correction, has been going on for almost 11 months. And literally until recently, the pair was above the 38.2% Fibonacci level. However, over the past two months, it managed to fall to the Fibonacci level of 61.8% (1.1290). And the fall of last Friday shows that this level can be easily overcome this week. And going below the level of 61.8% greatly reduces the likelihood of a resumption of the global upward trend. It's all the fault, as mentioned above, of the fundamental background, which has deteriorated sharply in recent weeks. It's not even that Christine Lagarde does not see a single opportunity for tightening monetary policy. The fact is that the States have very well restored their economy thanks to the QE program, now they have begun to wind it down, and next year, as the market is sure, they will raise the key rate. Thus, despite the inflated national debt and record inflation for 30 years, the American economy now looks much stronger than the European one. And the tightening of monetary policy has always been a bullish factor for the national currency. Thus, the weakness of the ECB's position and the strength of the Fed's position is equal to the growth of the US currency, which we are now observing.
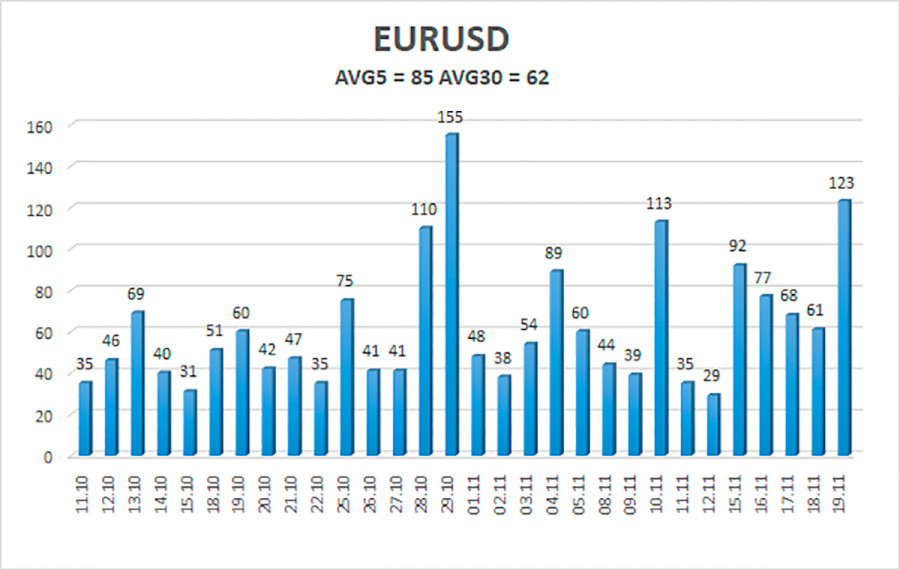
The volatility of the euro/dollar currency pair as of November 22 is 85 points and is characterized as "average". Thus, we expect the pair to move today between the levels of 1.1197 and 1.1367. A reversal of the Heiken Ashi indicator upwards will signal a new round of corrective movement.
Nearest support levels:
S1 – 1.1230
S2 – 1.1169
S3 – 1.1108
Nearest resistance levels:
R1 – 1.1292
R2 – 1.1367
R3 – 1.1414
Trading recommendations:
The EUR/USD pair resumed its downward trend. Thus, today, it is necessary to stay in short positions with targets of 1.1230 and 1.1169 until a new reversal of the Heiken Ashi indicator upwards. Purchases of the pair should be considered if the price is fixed above the moving average, with targets of 1.1414 and 1.1475.
Explanations to the illustrations:
Linear regression channels - help determine the current trend. If both are directed in the same direction, then the trend is strong now.
Moving average line (settings 20.0, smoothed) - determines the short-term trend and the direction in which to trade now.
Murray levels - target levels for movements and corrections.
Volatility levels (red lines) - the likely price channel in which the pair will spend the next day, based on current volatility indicators.
CCI indicator - its entry into the oversold area (below -250) or into the overbought area (above +250) means that a trend reversal in the opposite direction is approaching.
The material has been provided by InstaForex Company - www.instaforex.com