
GBP/USD 5M
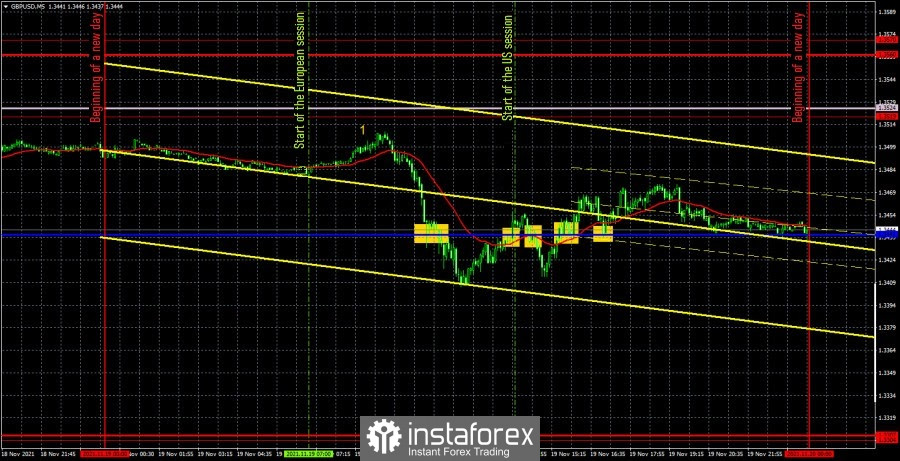
The GBP/USD pair continued to trade very indistinctly on Friday. The volatility for this pair was lower than for the EUR/USD pair, which always looks very strange. There were also very strange movements during the day, and the macroeconomic background was completely ignored by the markets. In particular, the only macroeconomic report of the day – retail sales in the UK - was supposed to provoke the growth of the British currency (figure "1" in the chart), but instead the pound crashed down. At the same time, in the second half of the day, the movements were already quite strange, based on nothing, and the Kijun-sen line never aroused any interest and resistance among traders, which is also very unusual. In addition, none of the important levels were reached during the day. As a result, all trading signals formed near the critical line and all of them turned out to be false, unfortunately. It remains only to figure out how to trade on Friday. The first sell signal was formed when the critical line was overcome, but after that the price managed to go down by only 30 points, which was enough to place a Stop Loss order at breakeven, at which the short position closed. The second signal, already for a long position, was formed during the reverse crossing of the Kijun-sen line, and it turned out to be blatantly false. It was also necessary to work it out, but a loss of 16 points was received on this transaction, since the price very quickly settled back below the Kijun-sen line. All subsequent signals should not have been worked out, since by that time two false signals had already been formed near the critical line. Thus, the loss was minimal.
GBP/USD 1H
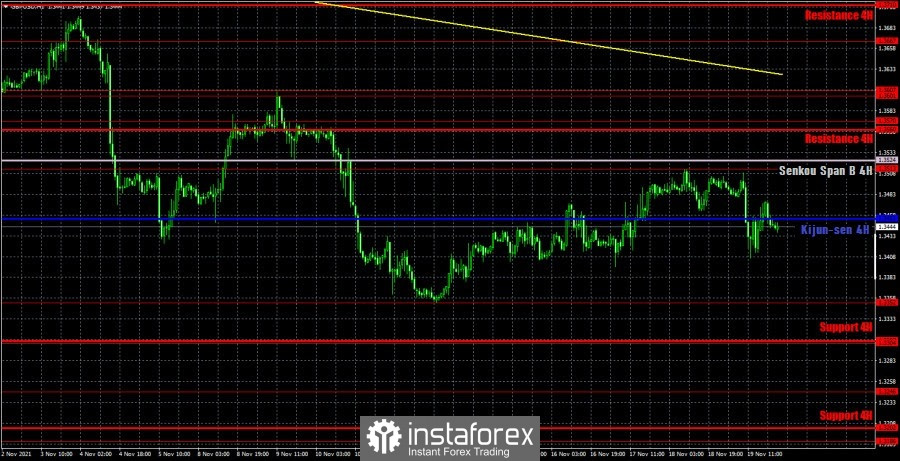
On the hourly timeframe, the pound/dollar pair continues to generally correct, but it could not settle above the Senkou Span B line, which is the strongest in the Ichimoku indicator. The downward trend persists below the trend line and below the Senkou Span B line, which means that the pound can resume its decline at any time. We distinguish the following important levels on November 22: 1.3304, 1.3352, 1.3519, 1.3570, 1.3601 - 1.3607. Senkou Span B (1.3524) and Kijun-sen (1.3453) lines can also be signal sources. Signals can be rebounds and breakthroughs of these levels and lines. It is recommended to set the Stop Loss level at breakeven when the price passes 20 points in the right direction. The Ichimoku indicator lines can move during the day, which should be taken into account when looking for trading signals. There will be nothing of interest in the UK and US on Monday. Since the correction for the pound is rather weak, and the European currency continues to fall sharply, one could assume that today the pair will tend to fall. However, it should also be remembered that the correlation between the two major pairs is not 100% right now.
We recommend you to familiarize yourself:
Overview of the EUR/USD pair. November 22. Another blow to the euro currency from Christine Lagarde.
Overview of the GBP/USD pair. November 22. The British pound fell with the euro.
Forecast and trading signals for EUR/USD for November 22. Detailed analysis of the movement of the pair and trade deals.
COT report
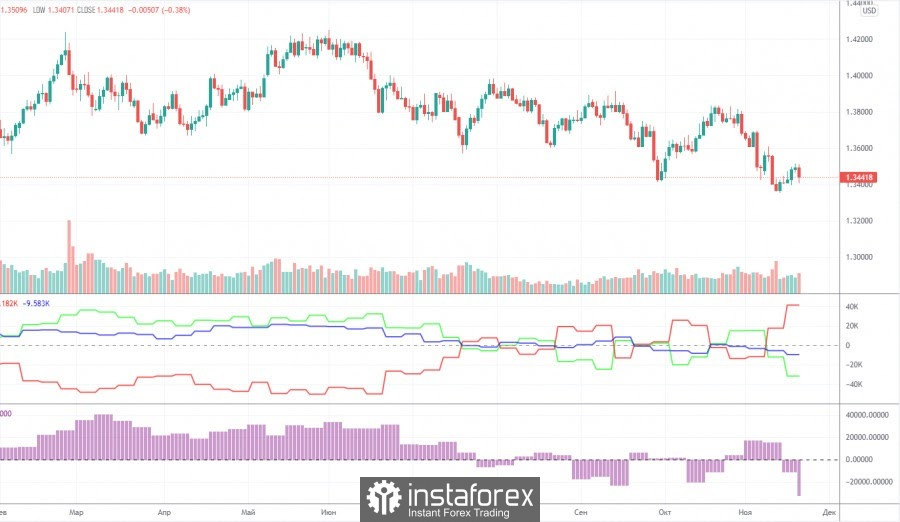
The mood of professional traders became much more bearish during the last reporting week. However, this should not be surprising, since the mood of major players has been constantly changing over the past few months, which perfectly reflects the first indicator in the chart above. The green and red lines, which indicate the net positions (in other words, the mood) of non-commercial and commercial traders, constantly change the direction of movement and constantly change their position relative to the zero level. The last reporting week only confirmed us in these conclusions. The green line has dropped significantly again, and the red line has increased significantly, although a couple of weeks ago it was the opposite. Thus, formally, the mood of professional traders has become more bearish, but in reality it changes every couple of weeks, so it is impossible to make a long-term conclusion. The non-commercial group closed 4,000 buy contracts (longs) and opened 17,000 sell contracts (shorts) during the reporting week. Thus, the net position decreased by 21,000 contracts at once, which is a lot for the pound. However, this does not matter much, since the net position of non-commercial traders also constantly jumps up and down, which is eloquently signaled by the second indicator in the chart above. It should also be noted that in the long term, the pound/dollar exchange rate itself also constantly jumps up and down. Thus, it is not possible to make a long-term forecast based on COT reports.
Explanations for the chart:
Support and Resistance Levels are the levels that serve as targets when buying or selling the pair. You can place Take Profit near these levels.
Kijun-sen and Senkou Span B lines are lines of the Ichimoku indicator transferred to the hourly timeframe from the 4-hour one.
Support and resistance areas are areas from which the price has repeatedly rebounded off.
Yellow lines are trend lines, trend channels and any other technical patterns.
Indicator 1 on the COT charts is the size of the net position of each category of traders.
Indicator 2 on the COT charts is the size of the net position for the non-commercial group.
The material has been provided by InstaForex Company - www.instaforex.com