
Nasdaq 100 technology index (#NDX) is rising in the morning of the American session after having closed the week below the SMA of 21. Now it tries to break and consolidate above this moving average. A break from the weekly high at 15,496 could be a sign of a bullish move and the index could continued its rally to 6/8 murray located at 15,625.
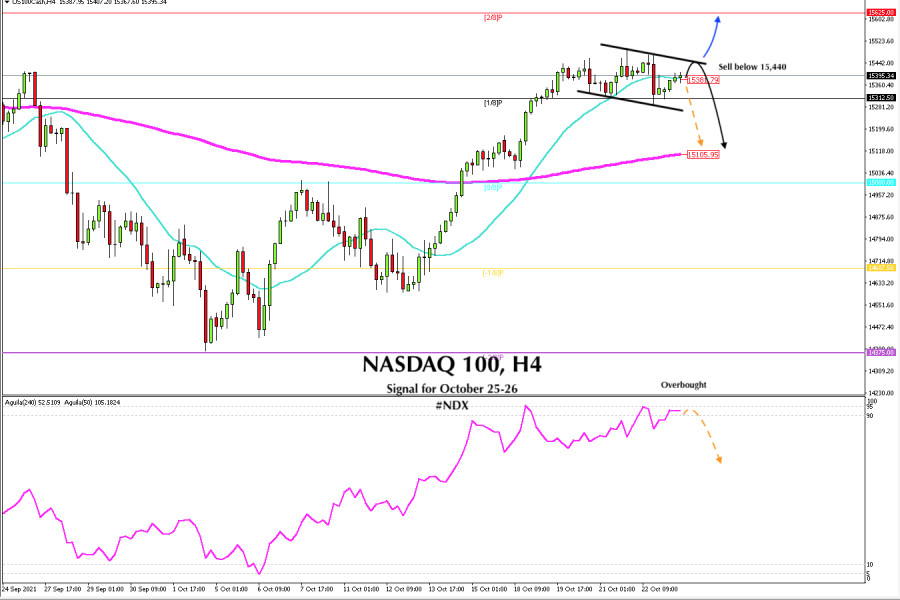
In the 4-hour chart, we can see that since October 19, the Nasdaq has been consolidating within a downtrend channel. We should expect that the top of this channel prevents new highs. A pullback towards this resistance will be a good opportunity to sell below 15,440.
A break through 15,500 will indicate a resumption of the uptrend and the index could quickly rise to the 6/8 murray resistance at 15,625. However, a correction towards the 200 EMA located at 15,105 could first occur in line with eagle indicator that is showing signs of the overbought market.
On the other hand, the eagle indicator has reached overbought levels, which means that a technical correction could occur in the next few hours towards the key support level at 15,1015. If the NASDAQ consolidates below the 21 SMA, it could confirm the bearish move and it will be a good opportunity for us to sell.
Our short-term forecast is that the Nasdaq consolidates below 15,387 and above 15,105. This may be the range for the next few days. If the Nasdaq surpasses these levels, it may be a sign of a bullish movement or a bearish movement longer.
Given that the main trend is bullish and if your strategy is to continue buying, a good point would be to wait for a technical bounce at the 200 EMA (15.105). This level can encourage a new rally and the Nasdaq could rise to 15,625 (6/8).
Support and Resistance Levels for October 25 - 26, 2021
Resistance (3) 15,625
Resistance (2) 15,546
Resistance (1) 15,453
----------------------------
Support (1) 15,299
Support (2) 15,183
Support (3) 15,102
***********************************************************
A trading tip for NASDAQ 100 for October 25 - 26, 2021
Sell below 15,440 (SMA 21) with take profit at 15,299 (bottom bearish channel) and 15,105 (EMA 200), and stop loss above 15,520.
The material has been provided by InstaForex Company - www.instaforex.com