
The Nasdaq technology index (#NDX) is trading under strong downward pressure. The main bearish channel is that originated on September 6 is still valid. The index has been making a sequence of lower lows for almost a month. At the time of writing, it is trading below the 21 SMA and below the 200 EMA, showing a bearish bias in the short term.
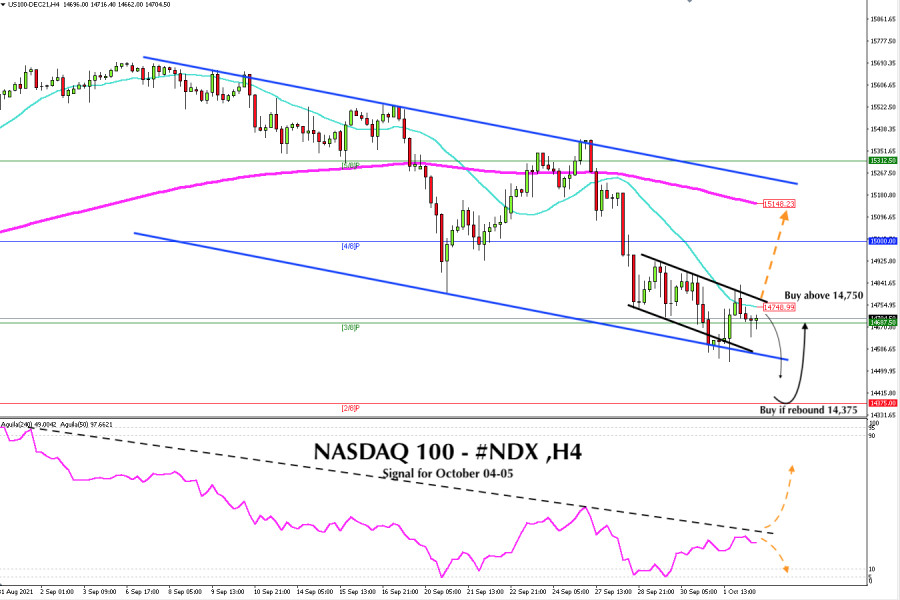
According to the 4-hour chart, we can see that the Nasdaq 100 is trading inside another secondary bearish channel below the SMA of 21. Since September 28, it has been consolidating in this range zone. It is likely to continue trading within this channel under downward pressure in the next few hours.
Only a sharp break and consolidation above the secondary bearish channel and above the 21 SMA will be a good opportunity to buy with targets at 15,148. There is the 200 EMA and a little higher is the top of the main bearish channel. If there is no clear confirmation, we should only sell below 14,748.
The medium-term outlook remains bearish according to the daily chart. However, the technical bounce may be preparing to turn to the upside. A breakout and consolidation through 14,750 (21 SMA) will confirm the bullish move and it will be a good time to buy.
The strongest support for the Nasdaq 100 is located at 2/8 of a murray. This area could be a good point of a technical bounce. It will be a last chance for the Nasdaq to gain momentum and reach the psychological level of 15,000.
According to the weekly chart, this is the first week after April 19 that the Nasdaq is below the SMA of 21. The weekly close below this point will clearly confirm a bearish signal and the index could fall to the level of 12,500 in the medium term.
The eagle indicator is showing a negative signal as a bearish trend line maintains the negative signal and shows low liquidity and a decrease in market volume.
Support and Resistance Levels for October 04 - 05, 2021
Resistance (3) 15,000
Resistance (2) 14,875
Resistance (1) 14,705
----------------------------
Support (1) 14,594
Support (2) 14,401
Support (3) 14,314
***********************************************************
Trading tip for NASDAQ 100 for October 04 - 05, 2021
Buy if it breaks above 14,750 (SMA 21) with take profit at 15,000 and 15,148 (EMA 200), stop loss below 15,680.
The material has been provided by InstaForex Company - www.instaforex.com