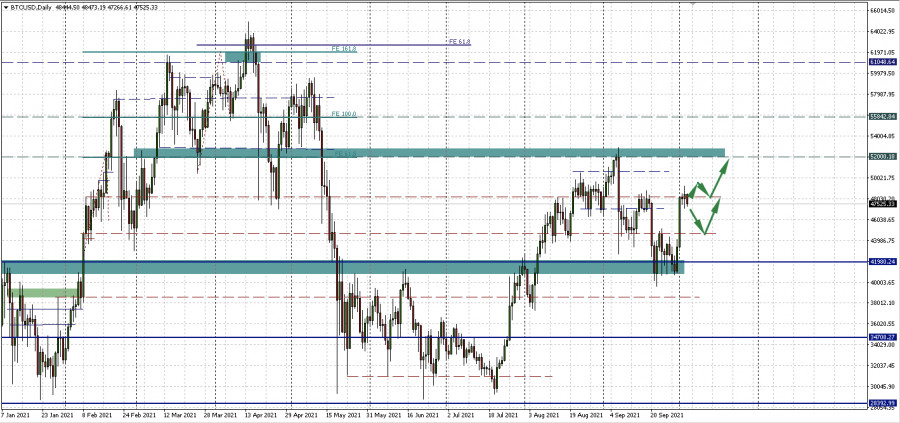
After a sharp rise on Friday, bitcoin moved to consolidation, stuck below the resistance level of 48,178.13, marked with a red dotted line.
The formation of a trade after a two-day growth from $40,000 to $48,000 is quite logical. From a technical point of view, the situation looks ambiguous, and, as noted in Friday's review, there are two options for the development of events. The first is a rebound from the level of 48,178.13 downward. The correction depth can reach the nearest support 44,807.24. The second is a consolidation above the horizontal at 48,178.13 and an increase in the resistance area of 52,000.18 - 52,929.15.
How to interpret the recent rise in BTC
This situation has one "but." While some market participants are tuning in to a successful bullish quarter and Uptober, others are plagued by vague doubts about whether Friday's rally was a "dead cat bounce."
A "dead cat bounce" in financial markets is a short-term recovery after a long recession. It always appears as a small rally after an extended downtrend. At first, a rebound in price appears to be a reversal of the dominant trend, but it is soon followed by a return to a downtrend in price.
According to analysts, the cryptocurrency market has seen many such dead cat bounces. A closer look at the net flows of bitcoin over past cycles has shown that such price spikes have historically had a consistent pattern.
Estimating the probability of a "dead cat bounce"
For this, the difference between the inflow and outflow of the coin is estimated - Exchange Netflow. The value will be negative when outflow prevails, and vice versa. If negative values persist, then buyer pressure is implied, which, as a rule, is optimistic for the price.
However, it has been observed that very positive Exchange Netflow values are accompanied or coincide with periods of dead cat bounce formation. The trend was noted in 2017, 2018, and then in 2019, when inflows dominated the Bitcoin chart.
Some have noted that the peak that formed after the May all-time high was actually a dead cat bounce, as evidenced by very positive net flow values.
However, this time, net flows are sharply negative, and the trend is similar to the cycle of 2017 when outflow prevailed and negative net flows influenced the price. Thus, it seems that the theory of "dead cat bounce" is not yet our case in the situation with the "Uptober", given the current negative net flows.
So, as outflows continue to dominate, meaning long-term holders are withdrawing more and more bitcoins for storage, the supply-demand curve for BTC points to an optimistic outlook.