
Technical outlook:
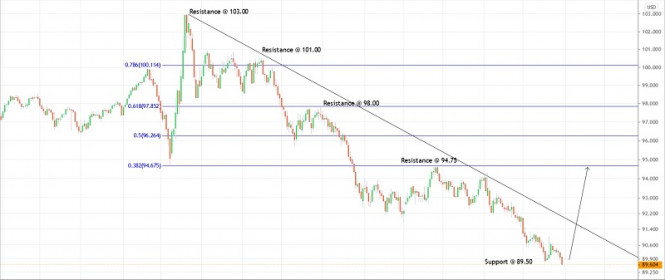
The US Dollar Index end-of-the day chart has been presented here with fresh lows registered yesterday around the 89.50 levels. The index is seen to be trading around he 89.60 levels at this point of writing and could be extremely close to carving a major bottom.
Immediate price resistance is seen around 91.04 while intermediary support comes in around the 89.50 levels respectively. Although the daily chart is showing a bullish divergence on the RSI (not shown here), we still need to see a clear breakout above 91.04 to confirm that a bottom is in place. The index topped around the 103.00 levels in March 2020 and since then it has been in control of bears, carving a series of lower lows and lower highs towards the 89.50 levels.
The overall bearish structure might be complete, and bulls might be preparing to take control back soon. Please note that potential remains for a push through the 94.50 levels, which is fibonacci 0.382 retracement of the entire drop between 103.00 through 89.50 respectively.
Trading plan:
Remain long, stop below 88.00, target @ 94.50
Good luck!
The material has been provided by InstaForex Company - www.instaforex.com