
GBP/USD 15M
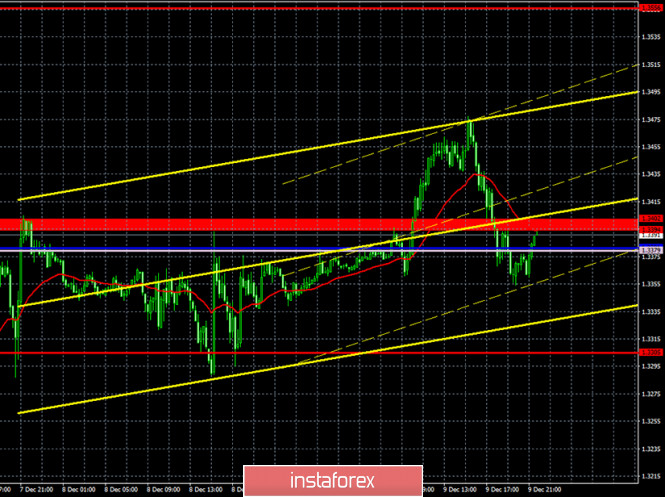
Both linear regression channels turned to the upside on the 15-minute timeframe, given that the pair has been recovering for the third day after falling by 300 points. The technical picture is now so confusing and ambiguous that it is possible to trade only from the Kijun-sen and Senkou Span B lines. All channels and trend lines are now of extremely small importance.
GBP/USD 1H
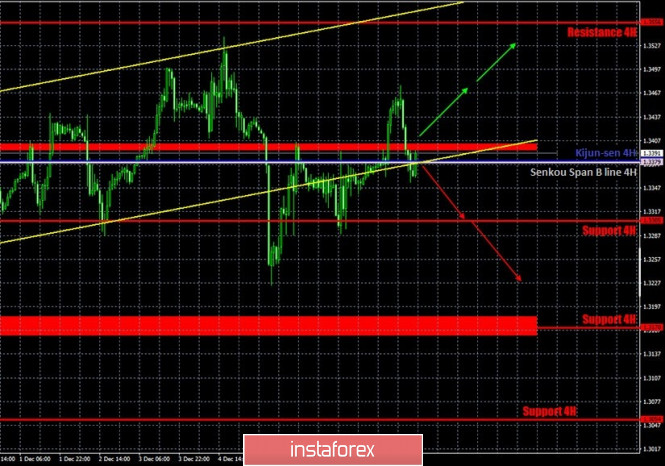
The GBP/USD pair continues to move erratically on Wednesday. Recall that at the end of the previous week and at the beginning of the current quote, the pound unexpectedly fell by 300 points. Many thought that a downward trend would now begin, which has been brewing for a couple of months, but instead the pair recovered 250 points over the next couple of days. The price initially left the rising channel, and then returned to it, thus forming a new false signal for the downward trend. By the way, given the current technical picture, there are still chances for a strong downward movement. We can even assume that quotes could fall below the previous local low of 1.3224. However, the pair has been trading in a very strange way for the past few weeks and it is extremely difficult to predict its movements. Even two very important and strong lines, Kijun-sen and Senkou Span B, do not present any significant resistance or support to the price. But trading can only be based on them.
COT report
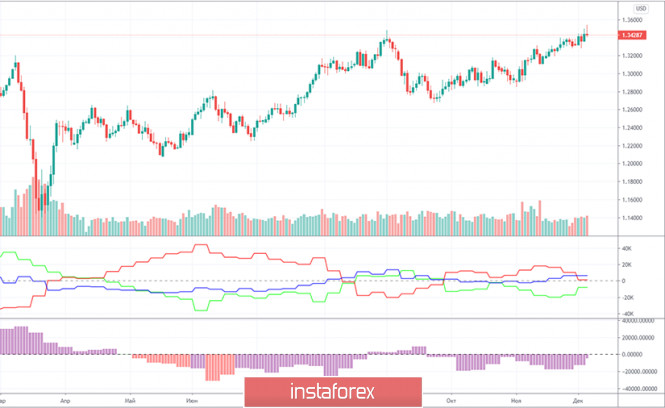
The GBP/USD pair did not grow and did not fall by a single point during the last reporting week (November 24-30). There were no price changes during this period. But in general, there was still an upward trend that extended into the following week. If in the case of the euro/dollar pair, we had been waiting for the beginning of a new downward trend, in the pound/dollar pair's case, the Commitment of Traders (COT) reports did not allow such conclusions to be drawn. You only need to look at both indicators in the chart to understand that there is no trend in the mood of major players. The first indicator constantly shows a shift in the mood of commercial and non-commercial traders from bearish to bullish and vice versa. The second indicator constantly shows that the net position of the "non-commercial" group is growing and decreasing. That is, we can not draw conclusions regarding the pair's future from the COT reports. Non-commercial traders opened 3,600 new Buy-contracts (longs) and closed 4,400 Sell-contracts (shorts) during the reporting week. The net position immediately increased by 8,000, which is a lot for the pound. But there were no price changes. The number of open Buy and Sell contracts for the non-commercial group is practically the same.
The fundamentals for the British currency on Wednesday were no different from Monday and Tuesday. Negotiations on the trade deal are ongoing, and time is running out (not until the deadline, but before the transition period expires), and the parties make similar statements day after day. And so nothing changes, and the markets continue to be nervous about this, as the presence or absence of a trade deal will be of enormous importance for the British economy and British business. So far, traders refuse to take into account the illusory likelihood of an agreement. They continue to believe that Michel Barnier and David Frost or Boris Johnson and Ursula von der Leyen will still be able to agree. We see no other reasons for the overall long-term strengthening of the British pound. The best way to see what is happening in the market is on the higher time frames, from 4-hour and higher. An upward trend is clearly visible there, but at the same time, erratic movements and constant changes in the direction are clearly visible.
The UK is set to publish reports on GDP for October and industrial production. Plus, the results of the negotiations between Ursula von der Leyen and Boris Johnson, who met specifically for this in Brussels, will probably be announced. In general, we believe that macroeconomic statistics will not have an effect on the pair's movements again. And the messages from the head of the European Commission or the British prime minister may not differ in any way from all previous statements of all high-ranking officials related to the negotiation process.
We have two trading ideas for December 10:
1) Buyers for the pound/dollar pair tried to regain the initiative yesterday, but their attempts were not enough. They need to return the pair above the resistance area of 1.3394-1.3402, and only after that will it be possible to count on an upward movement while aiming for the resistance level of 1.3556, which is very far away. Take Profit in this case will be up to 130 points. The pair is still moving erratically, which has been going on for several weeks, if not more. The trader needs to decide for himself whether to trade in such conditions.
2) Sellers seem to have made a tangible step towards a new downward trend, but they failed to overcome the support level of 1.3305. We recommend selling the pair while aiming for the support area of 1.3160 -1.3184 if quotes settle below 1.3305. Take Profit in this case can be up to 100 points. You can also open short deals for a rebound from below the Senkou Span B (1.3379) and Kijun-sen (1.3380) lines.
Forecast and trading signals for EUR/USD
Explanations for illustrations:
Support and Resistance Levels are the levels that serve as targets when buying or selling the pair. You can place Take Profit near these levels.
Kijun-sen and Senkou Span B lines are lines of the Ichimoku indicator transferred to the hourly timeframe from the 4-hour one.
Support and resistance areas are areas from which the price has repeatedly rebounded off.
Yellow lines are trend lines, trend channels and any other technical patterns.
Indicator 1 on the COT charts is the size of the net position of each category of traders.
Indicator 2 on the COT charts is the size of the net position for the "non-commercial" group.
The material has been provided by InstaForex Company - www.instaforex.com