
Yesterday, the pair moved down and tested the historical support level of 1.2073 (blue dotted line). News on the market is expected at 12:45, 13:30 (Euro) and 13:30 UTC (Dollar). It is possible to continue working downwards but the outcome will depend on the news released at 12:45 and 13:30 UTC for the Euro.
Trend analysis (Fig. 1).
Today, from the level of 1.2081 (the closing of yesterday's daily candle), the market can continue to move down with the goal of 1.2041 which is a pullback level of 23.6% (red dotted line). When testing this level, it is possible to work down with the target of 1.1987 – 21 average EMA (black thin line).
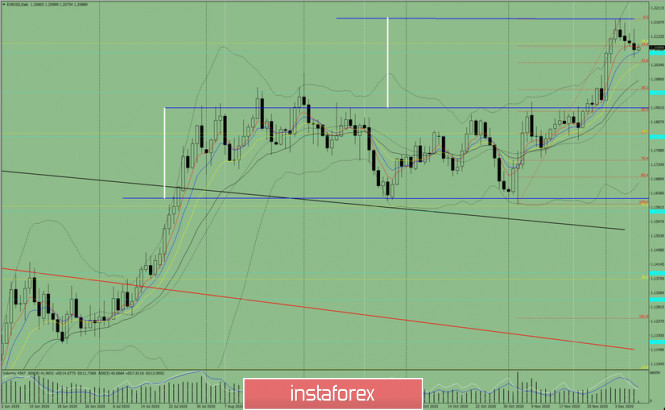
Figure 1 (daily chart).
Complex analysis:
- Indicator Analysis – down
- Fibonacci Levels – down
- Volumes – down
- Technical Analysis – down
- Trend Analysis – down
- Bollinger Bands – down
- Weekly Chart – down
General conclusion:
Today, from the level of 1.2081 (the closing of yesterday's daily candle) the market can continue to move down with the goal of 1.2041 which is a pullback level of 23.6% (red dotted line). When testing this level, it is possible to work down, with the target of 1.1987 – 21 average EMA (black thin line).
Alternative scenario: From the level of 1.2081 (the closing of yesterday's daily candle), an upward movement may begin with the target of 1.2147 which is the upper fractal (the daily candle from 09/12/2020). When testing this level, it is possible to work upwards with the target of 1.2177 which is the resistance level (blue thick line).
The material has been provided by InstaForex Company - www.instaforex.com