
To open long positions in the EUR / USD pair, you need:
The bulls' unsuccessful attempt to break above 1.2135 in the M5 chart, plus the return of the quote below the level, formed a good signal to sell the euro. Therefore, in the afternoon, the bears managed to pull the quote towards 1.2099, going down by about 35 pips in the market. Then, during the US session, after a breakout and consolidation below 1.2099, another sell signal was formed, after which the EUR / USD pair dropped by about 40 pips.
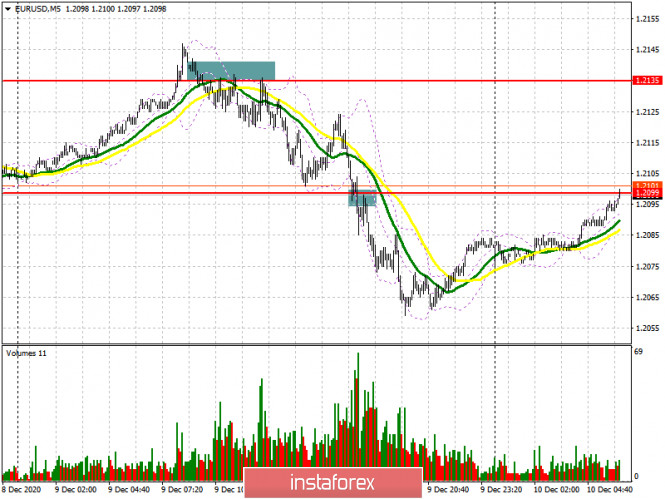
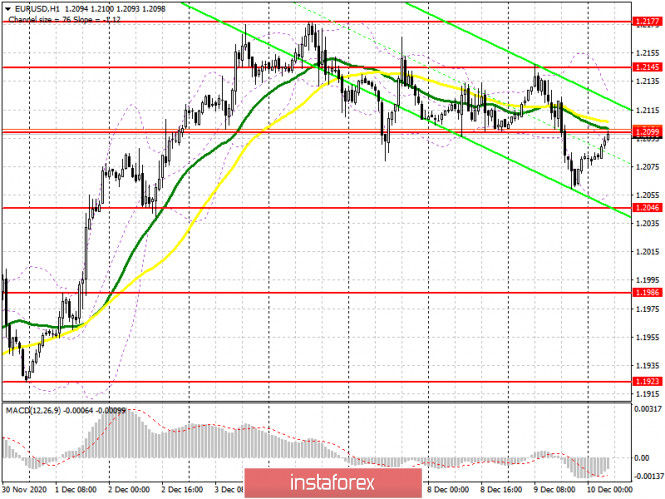
Euro bulls have to double their efforts to regain their market position. What they have to do is to break and consolidate above 1.2099, as the test of this level will form a good signal to open long positions, which could resume the upward trend that is now gradually changing with each renewal of the weekly low. The next target is to return the quote to 1.2145, and then test last week's high which is 1.2177, as a breakout of this level will result in the continued growth of the euro towards 1.2255 and 1.2339. However, this will only happen if the ECB does not make significant changes in its monetary policy and limit itself to the expected expansion of their bond purchase program. But in the case of a decline in the euro, only the false breakout of 1.2046 will signal to open long positions. Here, the euro may be bought from 1.1986, counting on a correction of about 20-25 pips within the day. Testing this level may result in the reversal of the upward trend in the short term.
To open short positions in the EUR / USD pair, you need:
At the moment, pound bears are focused on protecting the level of 1.2099, since a false breakout in this level will be a good signal to open short positions, which could continue the downward correction towards 1.2046. Then, further consolidation below will form another sell signal towards 1.21986, the target of which will be 1.1923. However, such a major drop will only happen if the ECB goes beyond investor expectations and expands their bond purchase program much more. The ECB may also hint about the option of introducing negative interest rates next year to stabilize inflationary pressures, which are seriously affected by the sharp rise in the euro. Therefore, if the EUR / USD pair rises above 1.2099, do not rush to sell. In this scenario, you can only rely on short positions from the level of 1.2145, or short positions from 1.2177.
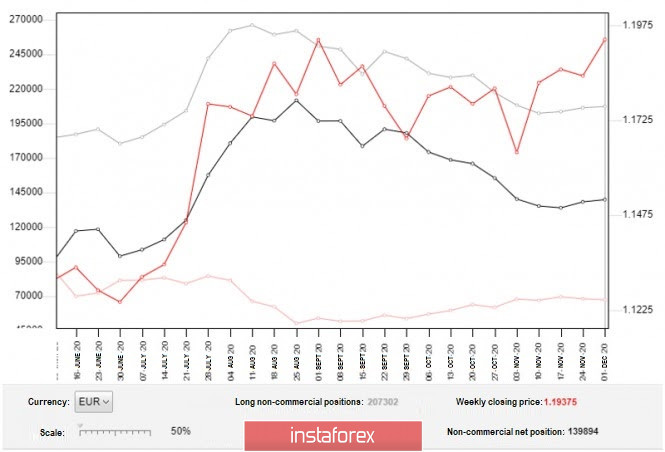
The Commitment of Traders (COT) report for December 1 indicates that there is an increase in long positions and a reduction in short positions. Buyers of risky assets believe in the continuation of the bull market, as well as in the further growth of the euro after a breakout in the 20th figure. Thus, long non-commercial positions rose from 206.354 to 207.302, while short non-commercial positions fell from 68.104 to 67.407. Meanwhile, the total non-commercial net position rose from 138.250 to 139.894.
Clearly, the delta has grown for another week, which indicates the clear advantage of buyers and a possible resumption of the medium-term upward trend. A larger recovery can occur if the UK and the EU forms a trade agreement, however, there was no such news last week. But since an EU summit is ahead, this issue may be finally resolved. In addition, demand for the euro will rise if there are news that restrictive measures will be lifted for the Christmas holidays, as well as if the ECB does not adjust its monetary policy.
Indicator signals:
Moving averages
Trading is carried out just below the 30 and 50-day moving averages, which indicates the advantage of buyers over sellers.
Note: The period and prices of the moving averages mentioned above are from the hourly chart (H1) and differs from the daily moving averages in the daily chart (D1).
Bollinger Bands
A breakout in the level of 1.2120 (upper border of the indicator) will increase demand for the euro, while a breakout in 1.2060 (lower border of the indicator) will result in another decline.
Description of indicators
- 50-day moving average - determines the current trend by smoothing volatility and noise. Marked in yellow on the chart.
- 30-day moving average - determines the current trend by smoothing volatility and noise. Marked in green on the chart.
- MACD line (Moving Average Convergence / Divergence) - 12 EMA, 26 EMA, 9 SMA.
- Bollinger Bands - 20-day
- Non-commercial traders are speculators such as individual traders, hedge funds and large institutions that use the futures market for speculative purposes and meet certain requirements.
- Long non-commercial positions represent the total long positions of non-commercial traders.
- Non-commercial short positions represent the total short positions of non-commercial traders.
- Total non-commercial net position is the difference between short and long positions of non-commercial traders.