
EUR/USD 15M
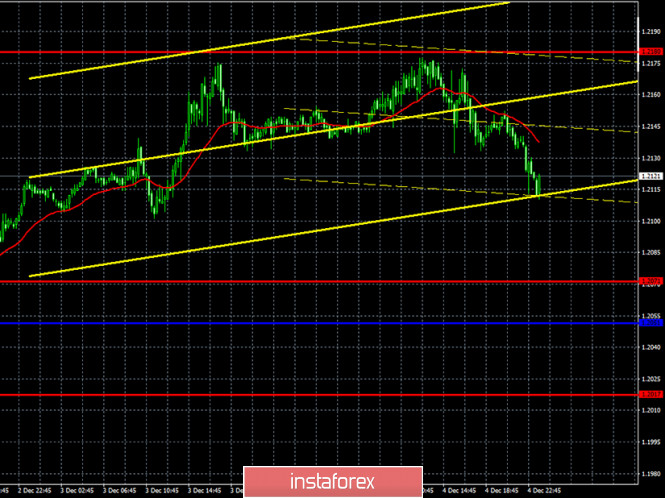
Both linear regression channels began to turn to the downside on the 15-minute timeframe, so the pair has a good chance of starting a noticeable downward correction. We are waiting for the quotes to fall, at least to the Kijun-sen line, near the area where the pair's fate will be decided.
EUR/USD 1H
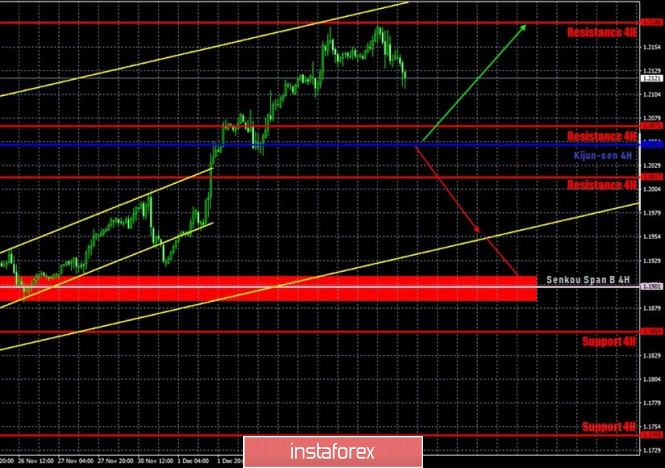
The EUR/USD pair tried to reach the resistance level of 1.2180 on the hourly timeframe on Friday, December 4. However, we did not reach this level by just a point. However, we believe that this level has been reached twice. However, the pair and those who trade this pair still have problems. The upward trend is clearly visible, which is good. Since trading in a trend is always more pleasant than doing so in a flat or in an incomprehensible movement. However, the price has been constantly forming false breakouts and breakouts lately. All small trend lines and channels have been canceled. As a result, we only one have one at our disposal, the global rising channel, which dates back to November 4th. The pair's quotes are now in the upper area of this channel. Logically, after two unsuccessful attempts to overcome the 1.2180 level, now the pair should fall. However, the upward trend will still be present above the critical Kijun-sen line. Therefore, we advise you not to rush to sell the pair.
COT report
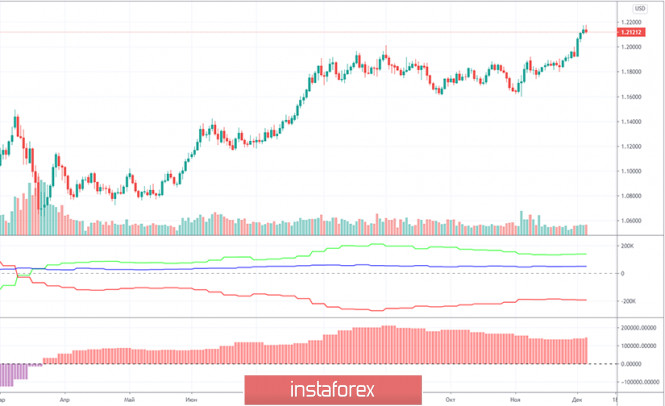
The EUR/USD pair grew by only 80 points during the last reporting week (November 24-30). But the new Commitment of Traders (COT) report indicates that professional traders are becoming more bullish for the second consecutive week. This time, the "non-commercial" group opened 4,300 new Buy-contracts (longs) and closed 300 sell-contracts (shorts). These numbers are not great. Even the general changes in favor of the bulls over the past two weeks cannot be called "breaking the bearish trend". However, the net position of non-commercial traders has been growing for two consecutive weeks. And, apparently, it began to grow synchronously with the resumption of the euro/dollar pair's growth. Unfortunately, COT reports come out three days late. Thus, they can be used to determine the trend, but, as is the case with fundamental analysis, technical confirmation is always required for any conclusions drawn from the COT reports. What do we end up with? The number of open Buy-contracts for professional traders remains high at 212,000, and the number of Sell-contracts is three times less than 67,000. The gap between the two began to narrow around September (the second indicator showing the net position of the non-commercial group), but it is currently growing again. Therefore, we still expect the upward trend to end, because this is what the data of the COT report is implying (especially the first indicator). But we need technical confirmation of this.
No macroeconomic reports from the EU last Friday, but there were several quite important ones from America. Let's start with the unemployment rate, which fell from 6.9% to 6.7%. Average hourly wages rose 4.4% y/y. However, the most important indicator was the NonFarm Payrolls. And traders were disappointed with it the most. Although disappointed isn't exactly the right word, since they ignored macroeconomic statistics again. The number of new jobs created outside of agriculture reached 245,000, while the forecast was +469,000. After such a value, the US dollar should have fallen by 100 points down. However, it suddenly increased in the afternoon. Therefore, the dollar did not fall on the very day when it would have been justified, instead, it surprisingly grew.
No important reports or events scheduled for the EU and the US on Monday. No global fundamental themes, the development of which could now cause the market to react. At the same time, the euro remains extremely overbought. The US dollar is completely out of demand in 2020 (after March, which is when the pandemic began), although it is absolutely impossible to say that the American economy is now the weakest of all the developed ones. Because if you compare it to the EU, the US causes less concern.
We have two trading ideas for December 7:
1) Buyers continue to hold the pair in their hands. Therefore, you are advised to continue trading upward while aiming for the resistance level of 1.2180 when the correction ends. A rebound from the Kijun-sen line (1.2051) can now be used as a signal for new long deals. Take Profit in this case can be up to 100 points. You can also look for possible points for long deals near the lower line of the rising channel.
2) Bears are releasing the pair from their hands more and more every day, nevertheless, the current fundamental background allows them to count on a downward reversal soon. Thus, you are advised to open sell orders while aiming for the Senkou Span B line (1.1901) if the price settles below the Kijun-sen line (1.2051). Take Profit in this case can be up to 120 points.
Forecast and trading signals for GBP/USD
Explanations for illustrations:
Support and Resistance Levels are the levels that serve as targets when buying or selling the pair. You can place Take Profit near these levels.
Kijun-sen and Senkou Span B lines are lines of the Ichimoku indicator transferred to the hourly timeframe from the 4-hour one.
Support and resistance areas are areas from which the price has repeatedly rebounded off.
Yellow lines are trend lines, trend channels and any other technical patterns.
Indicator 1 on the COT charts is the size of the net position of each category of traders.
Indicator 2 on the COT charts is the size of the net position for the "non-commercial" group.
The material has been provided by InstaForex Company - www.instaforex.com