
Hourly chart of the EUR/USD pair
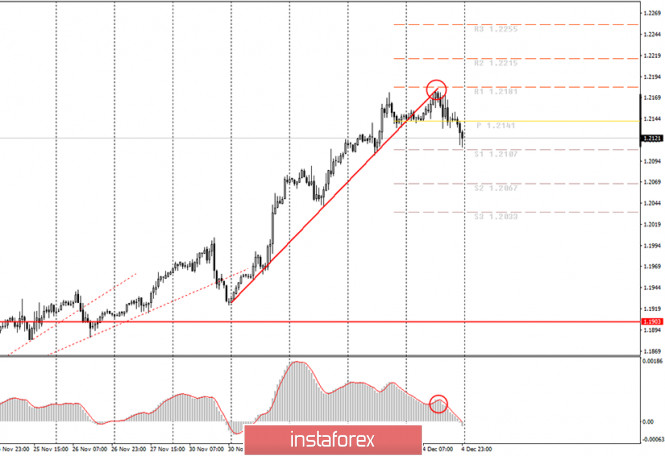
After the EUR/USD pair overcame the rising trend line on Friday, it went back to moving up and updated the previous day's high as if nothing happened. However, this is not the first case of a false trend reversal over the past few weeks. Earlier, we wrote about two trend lines, and the price also settled below it, but after that it went back to moving up. However, a round of technical correction began on Friday, which we warned about in the previous review. However, novice traders can assess the strength and power of this correction by themselves. The chart clearly shows the size of the upward trend segment (not even all, but only its final part) and the size of the correction, which is no more than 25%. Thus, we can formally declare the end of the upward trend, since the trendline was crossed anyway. In practice, the demand for the European currency remains very high after the price finally left the 1.1700-1.1900 channel, in which it spent four months. And most importantly, it is unfounded (from our point of view). Therefore, many technical formations and signals are now false. Markets are simply ignoring many factors right now. Trend trading systems (Ichimoku, Linear Regression Channels + Heiken Ashi) make it possible for trading to be more or less profitable. But this is already the next step in trading. Novice traders can start to deal with them and now is the best time for that.
No important news from the European Union on December 4, Friday, and no events of a global nature either. But there were several important publications from the US that were worth paying attention to. The most important would be the NonFarm Payrolls indicator (the number of new jobs created outside the agricultural sector). Their number turned out to be significantly lower than forecasted (245,000 versus 469,000). Therefore, this report should have caused the dollar to fall... If the dollar had not fallen uncontrollably for two weeks before. And if market participants did not continue to ignore macroeconomic statistics. And this is a paradoxical situation. The US dollar rose in price just when the macroeconomic background was against it...
No important publications or events scheduled for Monday. Of course, there are enough burning topics from both the EU and the US that should not be overlooked. However, the nature of the euro/dollar pair's movement at this time is such that markets brush off the vast majority of fundamental topics and macroeconomic reports. Even when the pair was inside the 1.17-1.19 horizontal channel, we regularly found short-term trends that allowed novice trends to trade consciously. Now the picture is much more complicated.
Possible scenarios for December 7:
1) Long positions have ceased to be relevant at the moment, since the price overcame the trend line. However, this trendline was purely nominal from the start. We said that any correction will cause the price to go below it. Any trend line should also take corrections into account. Thus, given the fact that the MACD indicator is discharged to the zero level, you can try to wait for a new buy signal on Monday and buy the pair while aiming for 1.2181. But close long deals when the MACD indicator turns down.
2) Trading down on Monday is not recommended for consideration. Although the price crossed the rising trend lines twice and settled below the third on Friday. In any case, you need to wait for a new sell signal from MACD and only then should you re-evaluate the pair's technical picture.
On the chart:
Support and Resistance Levels are the Levels that serve as targets when buying or selling the pair. You can place Take Profit near these levels.
Red lines are the channels or trend lines that display the current trend and show in which direction it is better to trade now.
Up/down arrows show where you should sell or buy after reaching or breaking through particular levels.
The MACD indicator (14,22,3) consists of a histogram and a signal line. When they cross, this is a signal to enter the market. It is recommended to use this indicator in combination with trend lines (channels and trend lines).
Important announcements and economic reports that you can always find in the news calendar can seriously influence the trajectory of a currency pair. Therefore, at the time of their release, we recommended trading as carefully as possible or exit the market in order to avoid a sharp price reversal.
Beginners on Forex should remember that not every single trade has to be profitable. The development of a clear strategy and money management are the key to success in trading over a long period of time.
The material has been provided by InstaForex Company - www.instaforex.com