
Trend analysis:
This week, the price can continue to move down, in order to reach the support line of the ascending channel - 1. 2671 (white bold line) and if this line is reached, work up with the target at 1.2877 - pullback level of 38.2% (red dashed line).
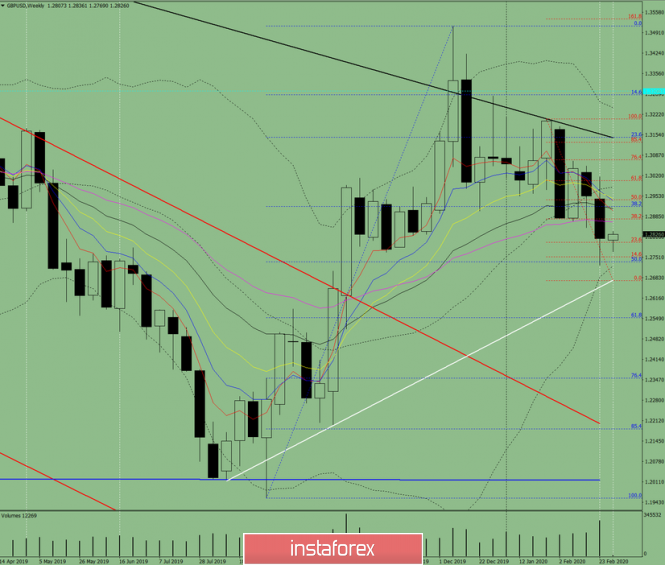
Fig. 1 (weekly schedule).
Comprehensive analysis:
- indicator analysis - down;
- Fibonacci levels - down;
- volumes - down;
- candlestick analysis - down;
- trend analysis - down;
- Bollinger lines - down;
- monthly chart - down.
The conclusion of a comprehensive analysis is a downward movement.
The overall result of calculating the candle of the GBP / USD currency pair according to the weekly chart: the price of the week will most likely have a downward trend with the absence of the first upper shadow of the weekly black candlestick (Monday - down) and the presence of the second lower shadow (Friday - up).
The first lower target of 1. 2671 is the support line of the upward channel (white bold line).
An unlikely upper scenario: working up with the first target 1.2941 - a pullback level of 50% (red dashed line), from a pullback level of 50.0% - 1.2735 (blue dashed line).
The material has been provided by InstaForex Company - www.instaforex.com