
4-hour timeframe
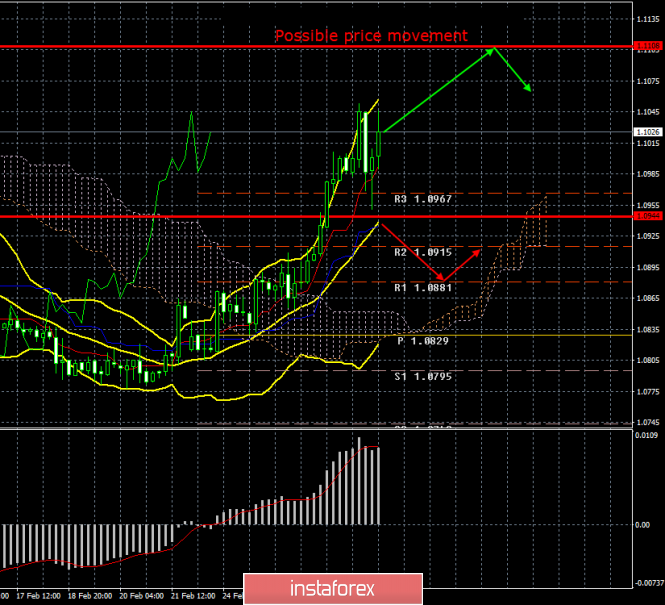
Amplitude of the last 5 days (high-low): 67p - 60p - 54p - 127p - 102p.
Average volatility over the past 5 days: 82p (average).
The EUR/USD currency pair broke all records in the last week of February, both growth and volatility. The euro continued to not sharply fall for most of the second month of 2020, but surely, but it spread its wings at the end of the month. If we compare the current rate with the course of the previous month, then the euro has fallen in price anyway. Thus, despite a more than positive week, the euro continues to lose ground against the US dollar. And this despite the fact that the United States, the dollar and the whole situation that has developed now in the world, are doing their best to "try" to help the euro currency.
For example, the US stock market, which fell 15% this week, could trigger a weakening dollar on all fronts. Paired with the euro, this factor may have provided some help. And paired with the pound - no. One way or another, if you look at longer-term timeframes, it becomes clear that the downward trend for the euro/dollar pair continues. Moreover, no one can say for sure why the euro has shown a record growth this week. We have already said that if we consider the entire fundamental background of recent days, it becomes obvious: the pressure on the dollar is exactly the same as the pressure on the euro. Coronavirus is not a purely American phenomenon. Moreover, in Europe, in particular in Italy, there are much more infected than in the United States, at least according to official information. Thus, the impact on the European economy will also be present and negative. The ECB and the Fed can equally resort to easing monetary policy due to the outbreak of the coronavirus.
In this article, we will examine all the macroeconomic statistics of the week to understand how macroeconomic statistics have changed in the EU and the US. It should be noted right away that macroeconomic factors ruled the market this week. If at the beginning of the trading week, in the complete absence of any important publications, a purely technical strengthening of the euro currency was observed, then at the end of the week a whole bunch of various fundamental information sowed panic among traders and there was no talk of any logical and reasonable trading.
No important macroeconomic statistics were published either in the United States or in the European Union on Monday, Tuesday and Wednesday. These days we can only note absolutely neutral GDP in Germany for the fourth quarter, which amounted to +0.4% y/y, and, accordingly, remains at almost zero levels of growth rates. Traders witnessed important reports on Thursday, which, however, did not have a special effect on the movement of the pair. US GDP for the fourth quarter, according to preliminary estimates, was +2.1% y/y. That was the forecast, that was the value of the previous quarter. Traders did not respond to this report. Then a more important indicator of orders for durable goods in the United States was published. All four derivatives of the indicator exceeded forecast values, but did not cause the slightest appreciation of the US currency. It can be said that for most of the week, the euro/dollar was generally traded solely under the influence of technical factors that required serious correction after a three-week fall. Friday's news didn't matter at all to market participants, as it was completely blocked by other events. Nevertheless, we cannot bypass this data.
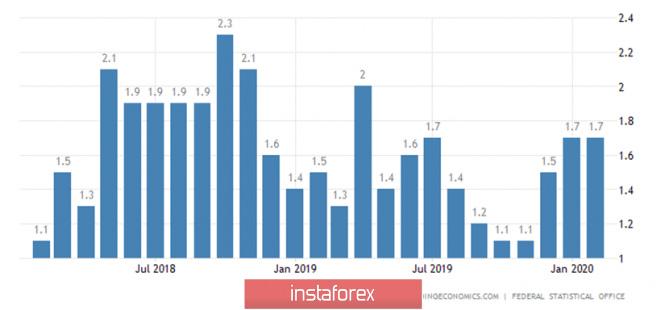
German inflation in February remained unchanged at 1.7% y/y. It cannot be said that this is frankly weak inflation, however, it remains insufficient. Thus, there is no particular reason to expect an acceleration of the pan-European inflation rate, which currently stands at 1.4% y/y. Accordingly, there is no reason to expect an improvement in the general economic condition of the European Union. Once again, we are forced to state that statistics from the EU are either failed or neutral at best. From across the ocean on Friday, information was received about changes in the level of income and expenses of the US population, which is not the most significant, as well as a consumer sentiment index from the University of Michigan, which is secondary. Such data will be discussed in more detail in the article on GBP/USD.
Thus, in general, we can say that the euro was just adjusted all week, and next week the "correction against correction" will be very logical. Since the last upward movement was also completely recoilless. The first goal of the correction will be the Kijun-sen critical line.
Trading recommendations:
The EUR/USD pair is still continuing its upward movement. Thus, now you can stay in long positions, but the MACD indicator has already turned down, and the likelihood of a correction beginning is very high. It will be possible to return to sales of the euro/dollar pair with the goal of the support level of 1.0881, when traders will be able to gain a foothold back below the critical line.
Explanation of the illustration:
Ichimoku indicator:
Tenkan-sen is the red line.
Kijun-sen is the blue line.
Senkou Span A - light brown dotted line.
Senkou Span B - light purple dashed line.
Chikou Span - green line.
Bollinger Bands Indicator:
3 yellow lines.
MACD indicator:
Red line and bar graph with white bars in the indicators window.
Support / Resistance Classic Levels:
Red and gray dashed lines with price symbols.
Pivot Level:
Yellow solid line.
Volatility Support / Resistance Levels:
Gray dotted lines without price designations.
Possible price movements:
Red and green arrows.
The material has been provided by InstaForex Company - www.instaforex.com